Randomness Analysis
The randomness of a token sequence describes that every theoretically possible token (based on the chosen alphabet and the number of digits) appears in an unpredictable way at some point and exactly once in a production line, in particular without (non-trivial) analytically properties or any stochastic pattern. The token sequence is neither reproducible nor predictable, neither in whole nor in part.
The randomness of token sequences for given alphabets is demonstrated here in a visual way using patterns found in numerical mappings of token sequences and their analytic transformations.
Analysis Archives
DICE - Randomness Analysis Archive (15.6 MB)
UPPER_EPCG30 - Randomness Analysis Archive (16.2 MB)
TRUE_RANDOM - Randomness Analysis Archive (15.7 MB)
MERSENNE_TWISTER - Randomness Analysis Archive (15.6 MB)
The linked archives contain
- some metrics of the tokens, of the scores and of the deltas as JSON¹
- the token data, the score and delta numbers as CSV
- all available plots as shown below as an example in PNG format
¹ only if the data weren't pseudo-randoms or physically generated randoms
Analysis Plots
The aim of the randomness plots is to show that the patterns found in a numerical mapping of a token sequence, obtained via the Unique Tokens API, cannot be distinguished from the patterns in sequences of numeric pseudo-randoms (MERSENNE_TWISTER) or physically generated numeric randoms (TRUE_RANDOM). The latter are numbers chosen at random from the given integer range without respecting uniqueness, i.e., they do not represent tokens and therefore should presents even less structural patterns.
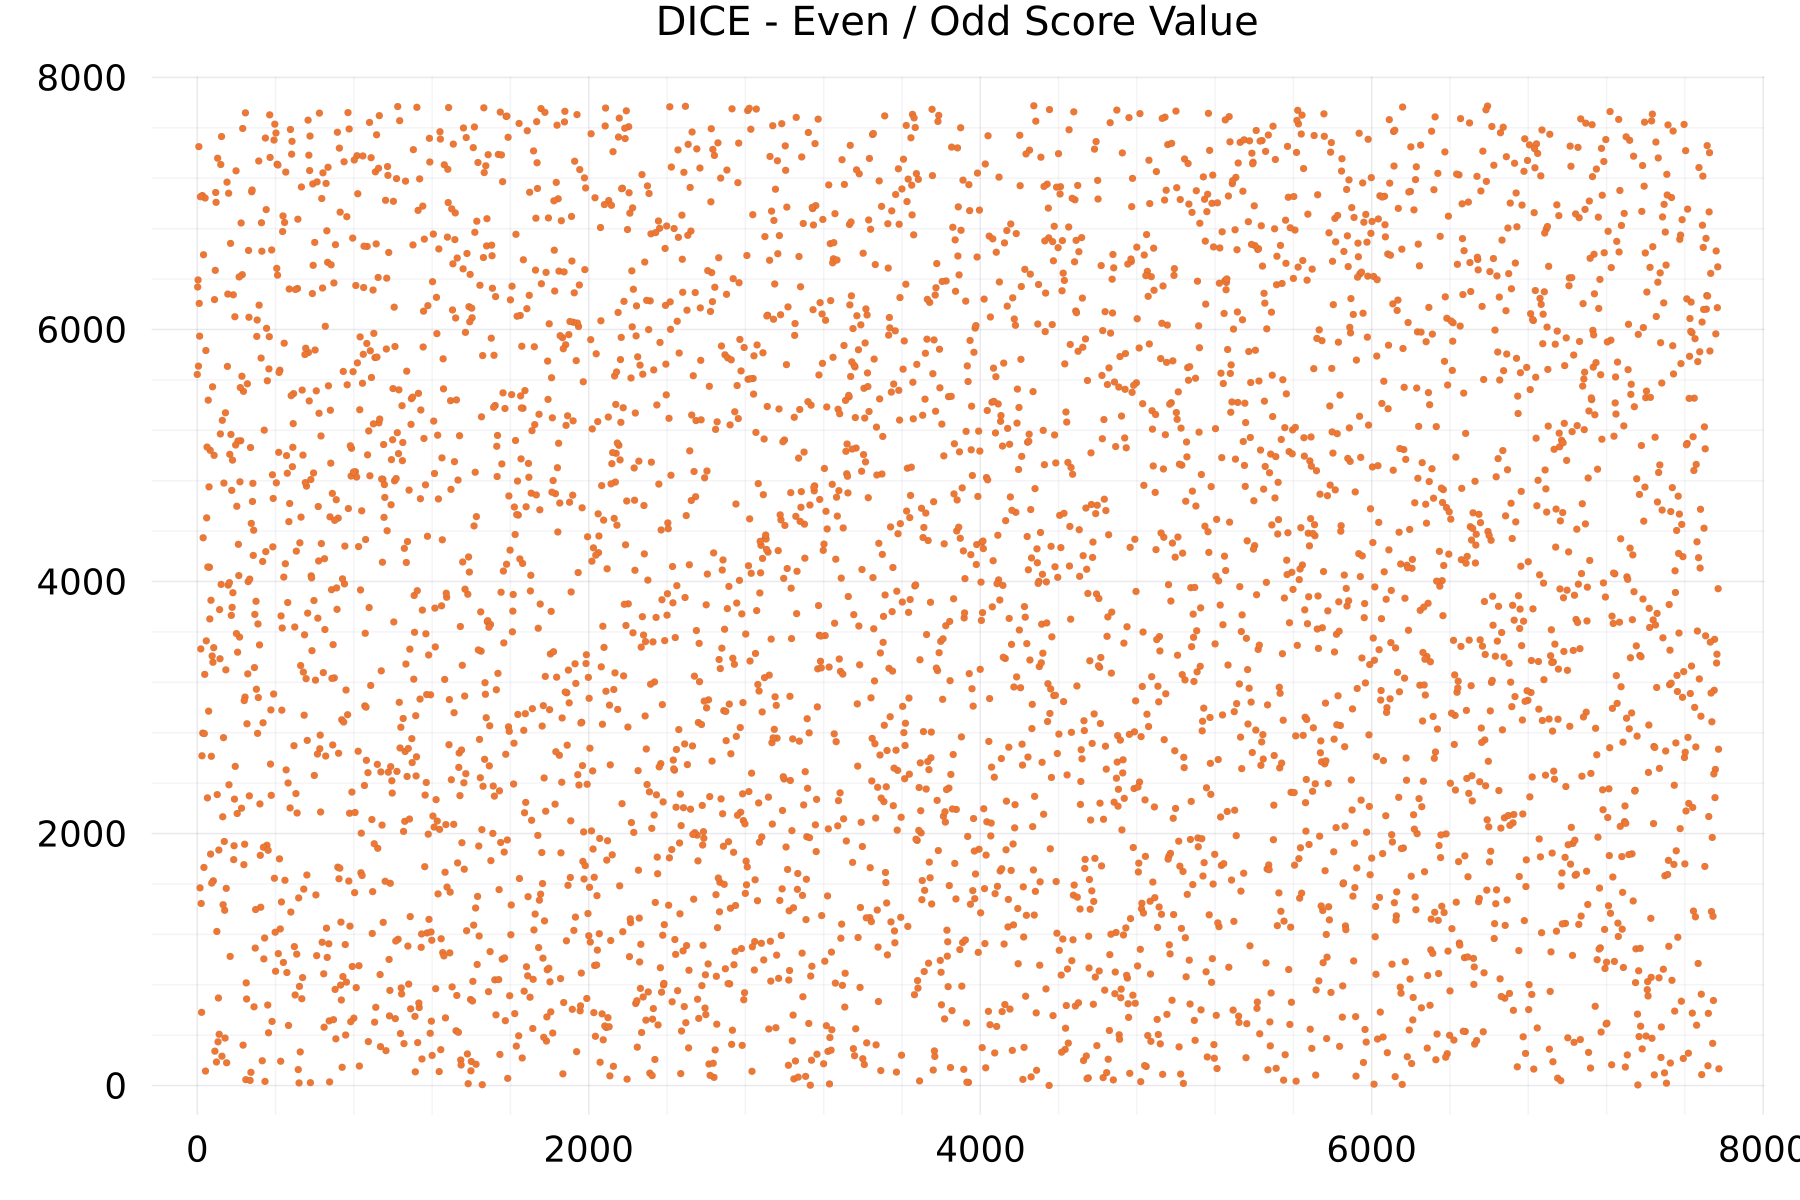
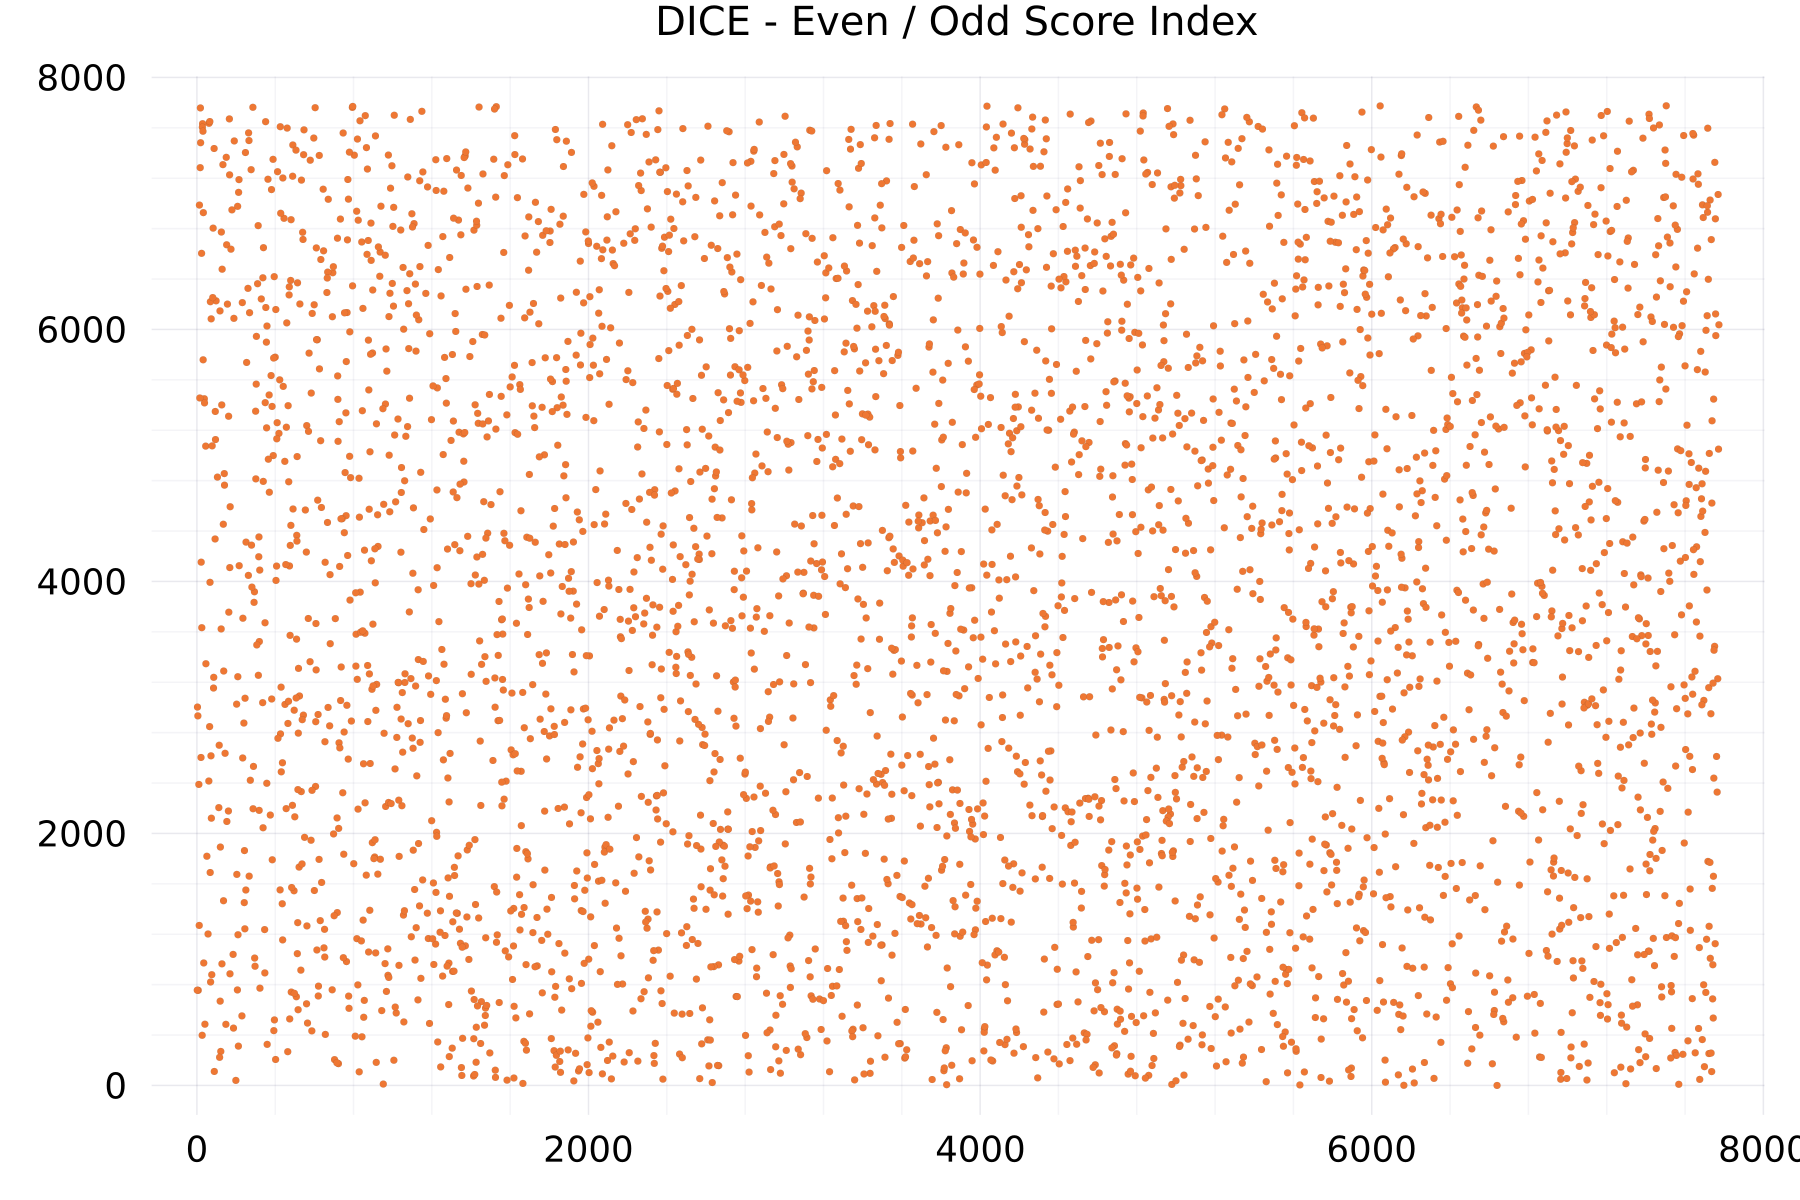
Some plots are scattergrams to contrast two subsets of the scores or deltas on the horizontal and vertical plot axes. The two subsets are separated either by the even / odd indexes (of the respective data to be plotted), or the even / odd data values themselves. In the latter case, when the subsets are unequal in size, the size of the smaller subset determines the number of data points displayed.
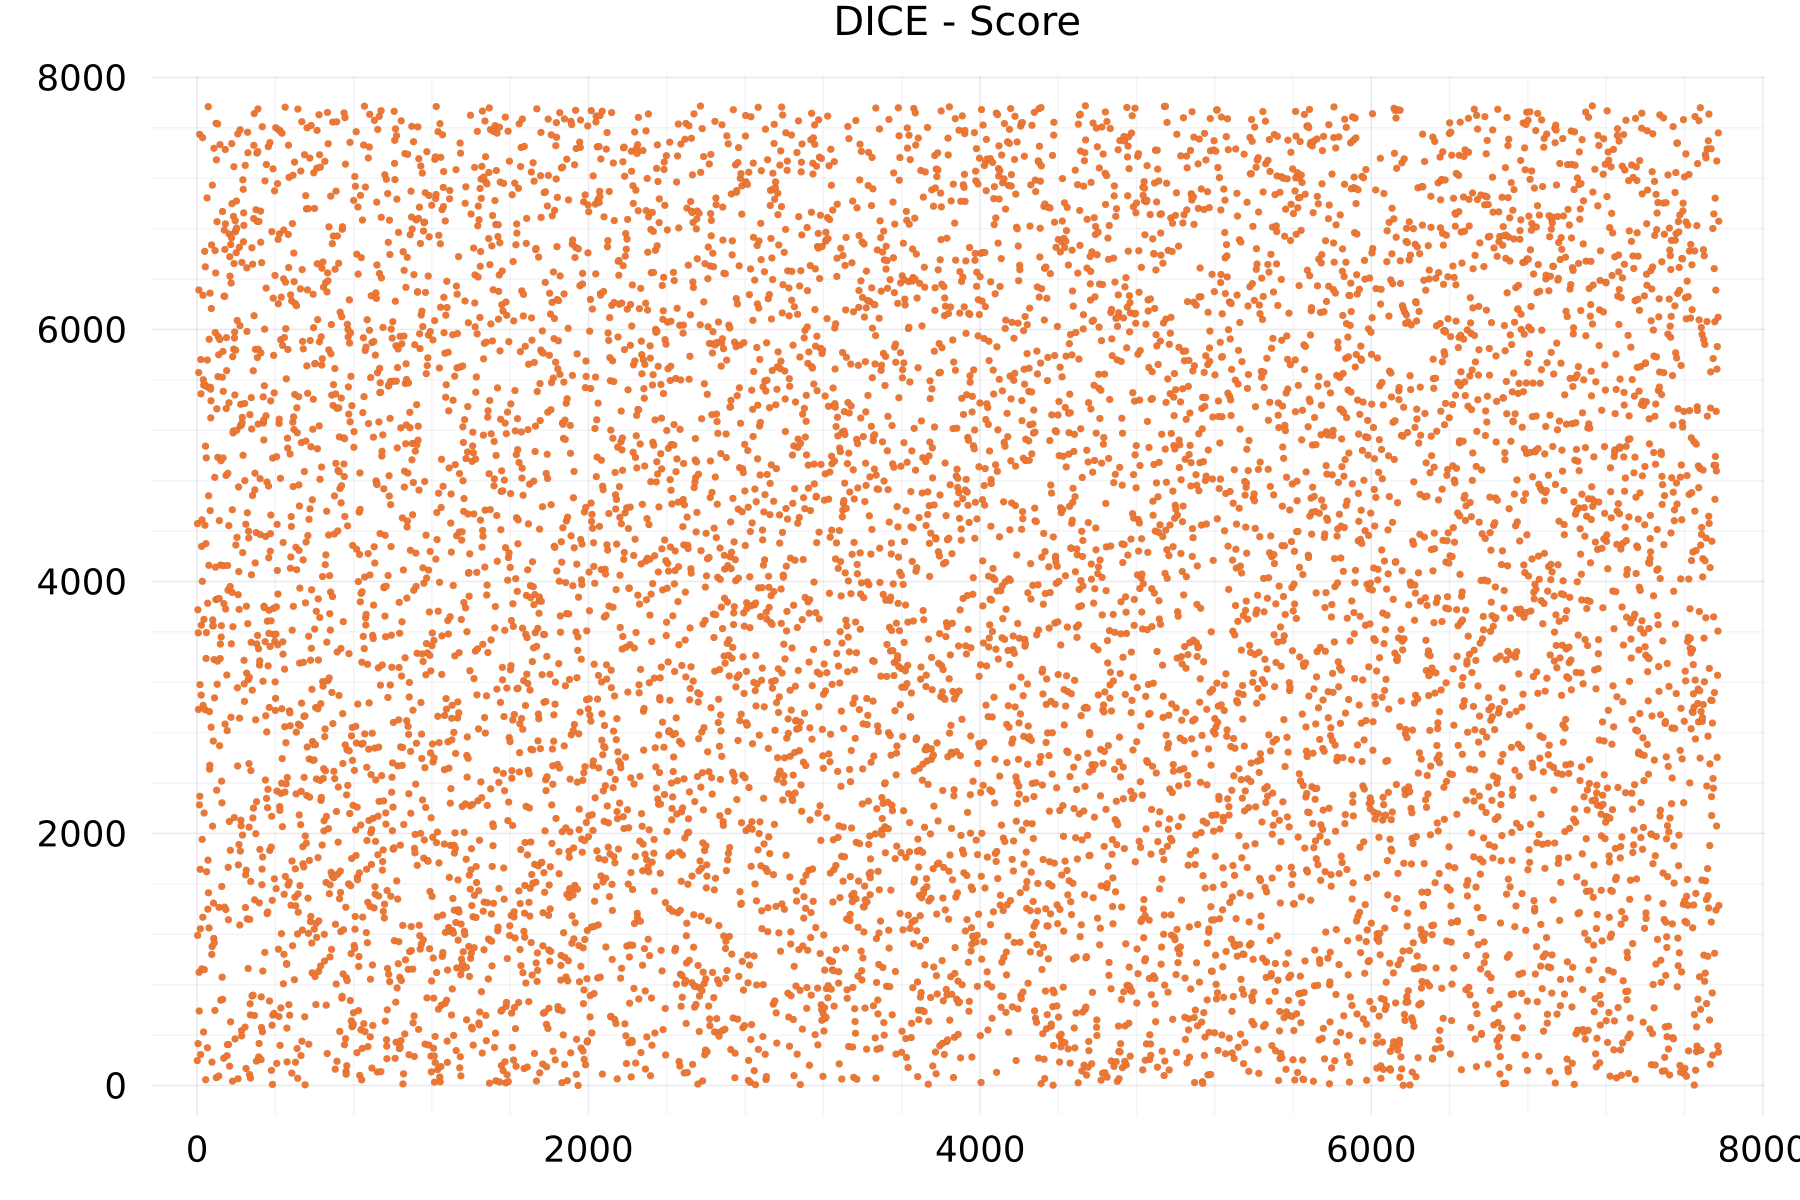
Score Plots
The plot shows as example for the DICE alphabet the numeric scores of 7,776 tokens.
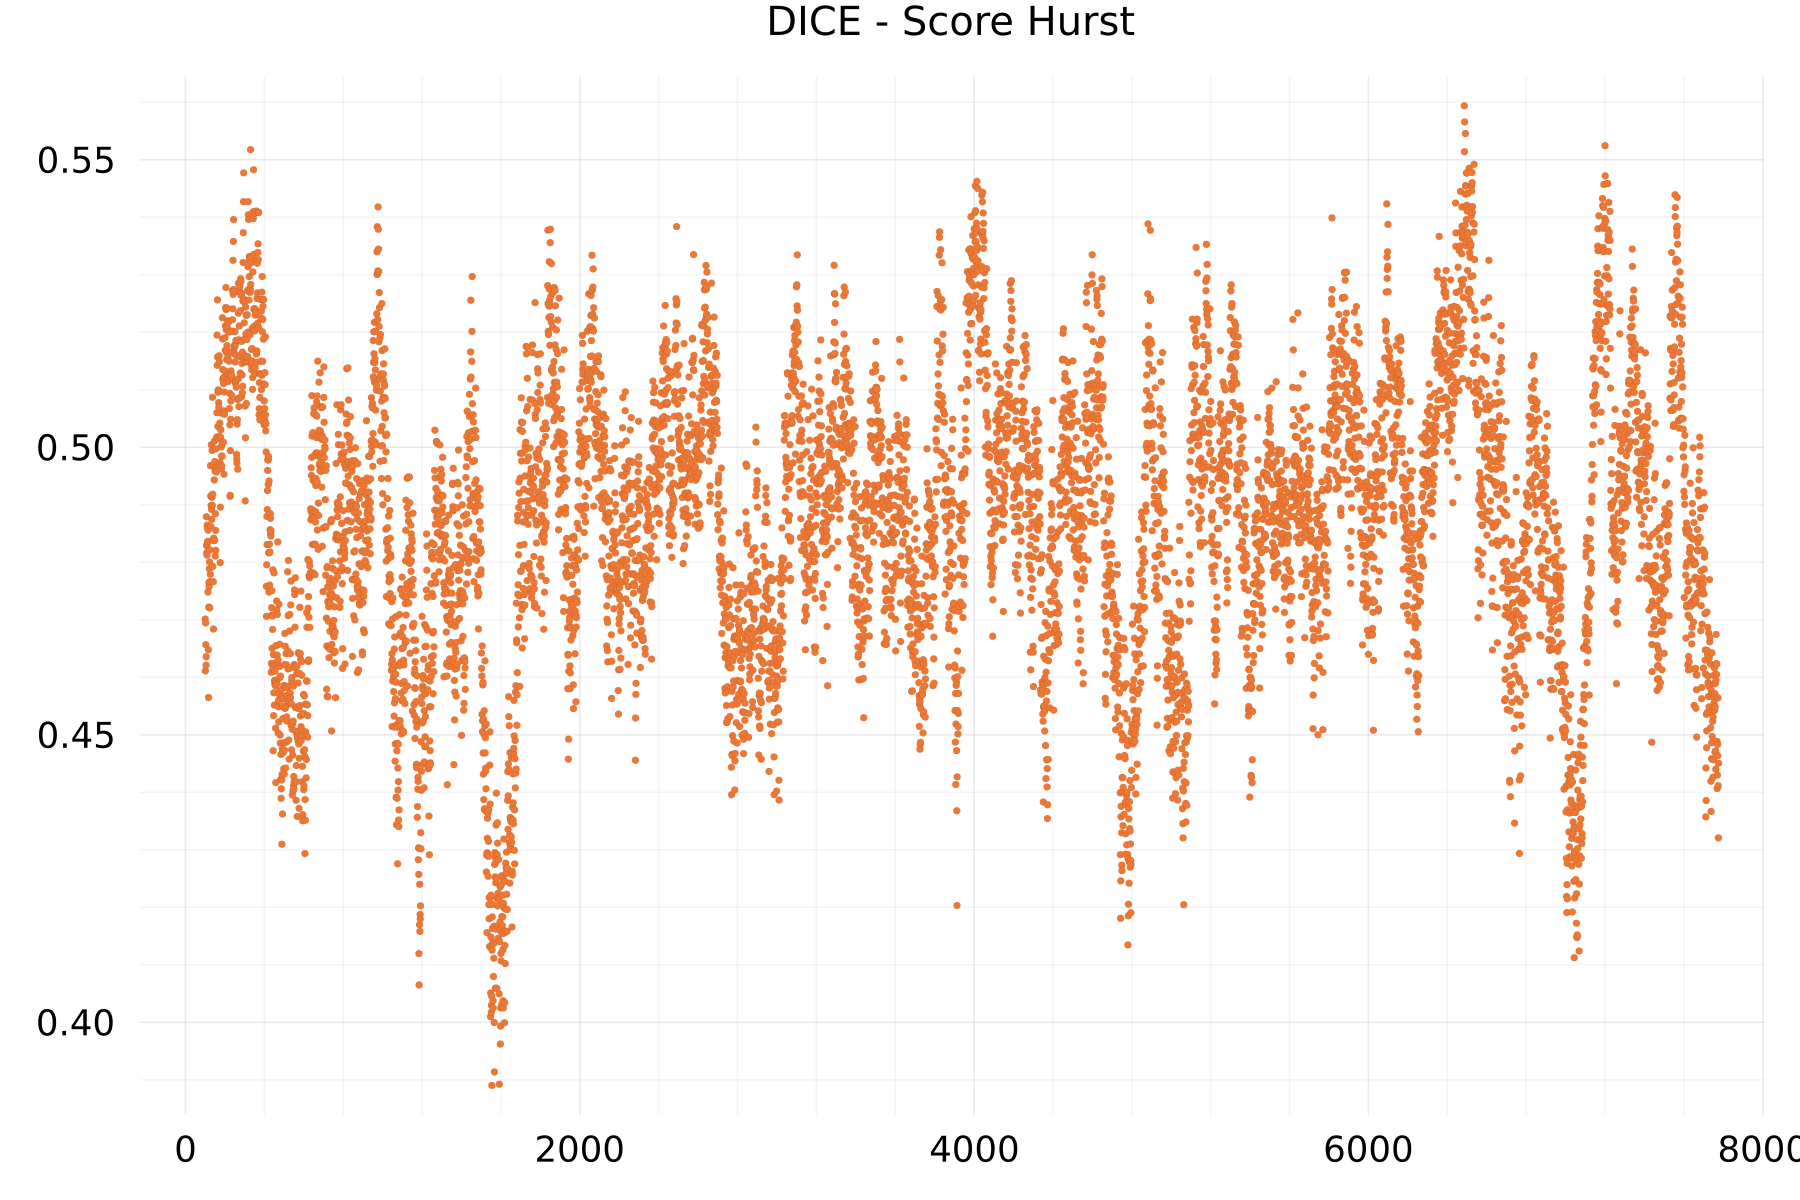
Score Hurst Plots
The plot shows as example for the DICE alphabet the hurst exponent of 7,776 scores.
Even / Odd Score Value Plots
The plot shows as example for the DICE alphabet the even- versus odd-values of 7,776 scores.
Even / Odd Score Index Plots
The plot shows as example for the DICE alphabet the scores at the even- versus odd-indexes.
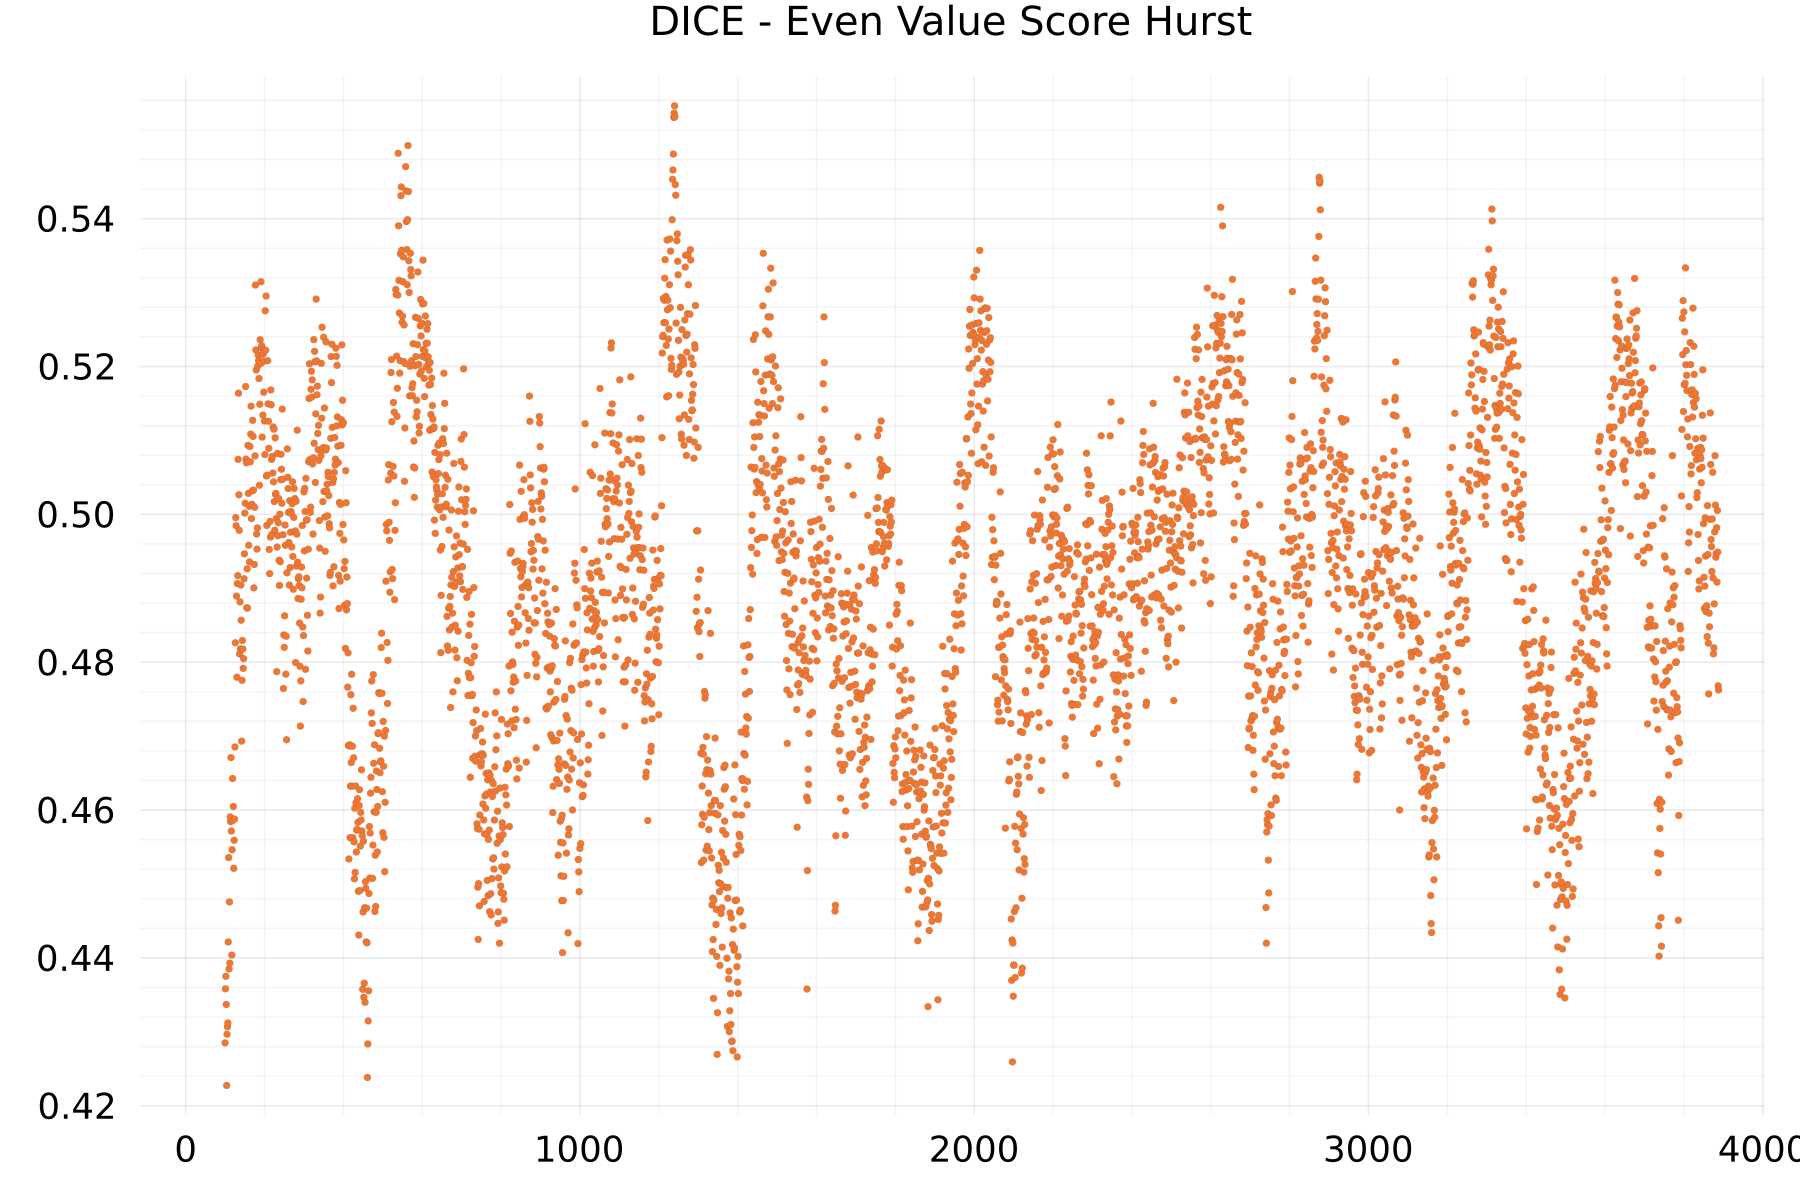
Even Value Score Hurst Plots
The plot shows as example for the DICE alphabet the hurst exponent of the even-valued scores.
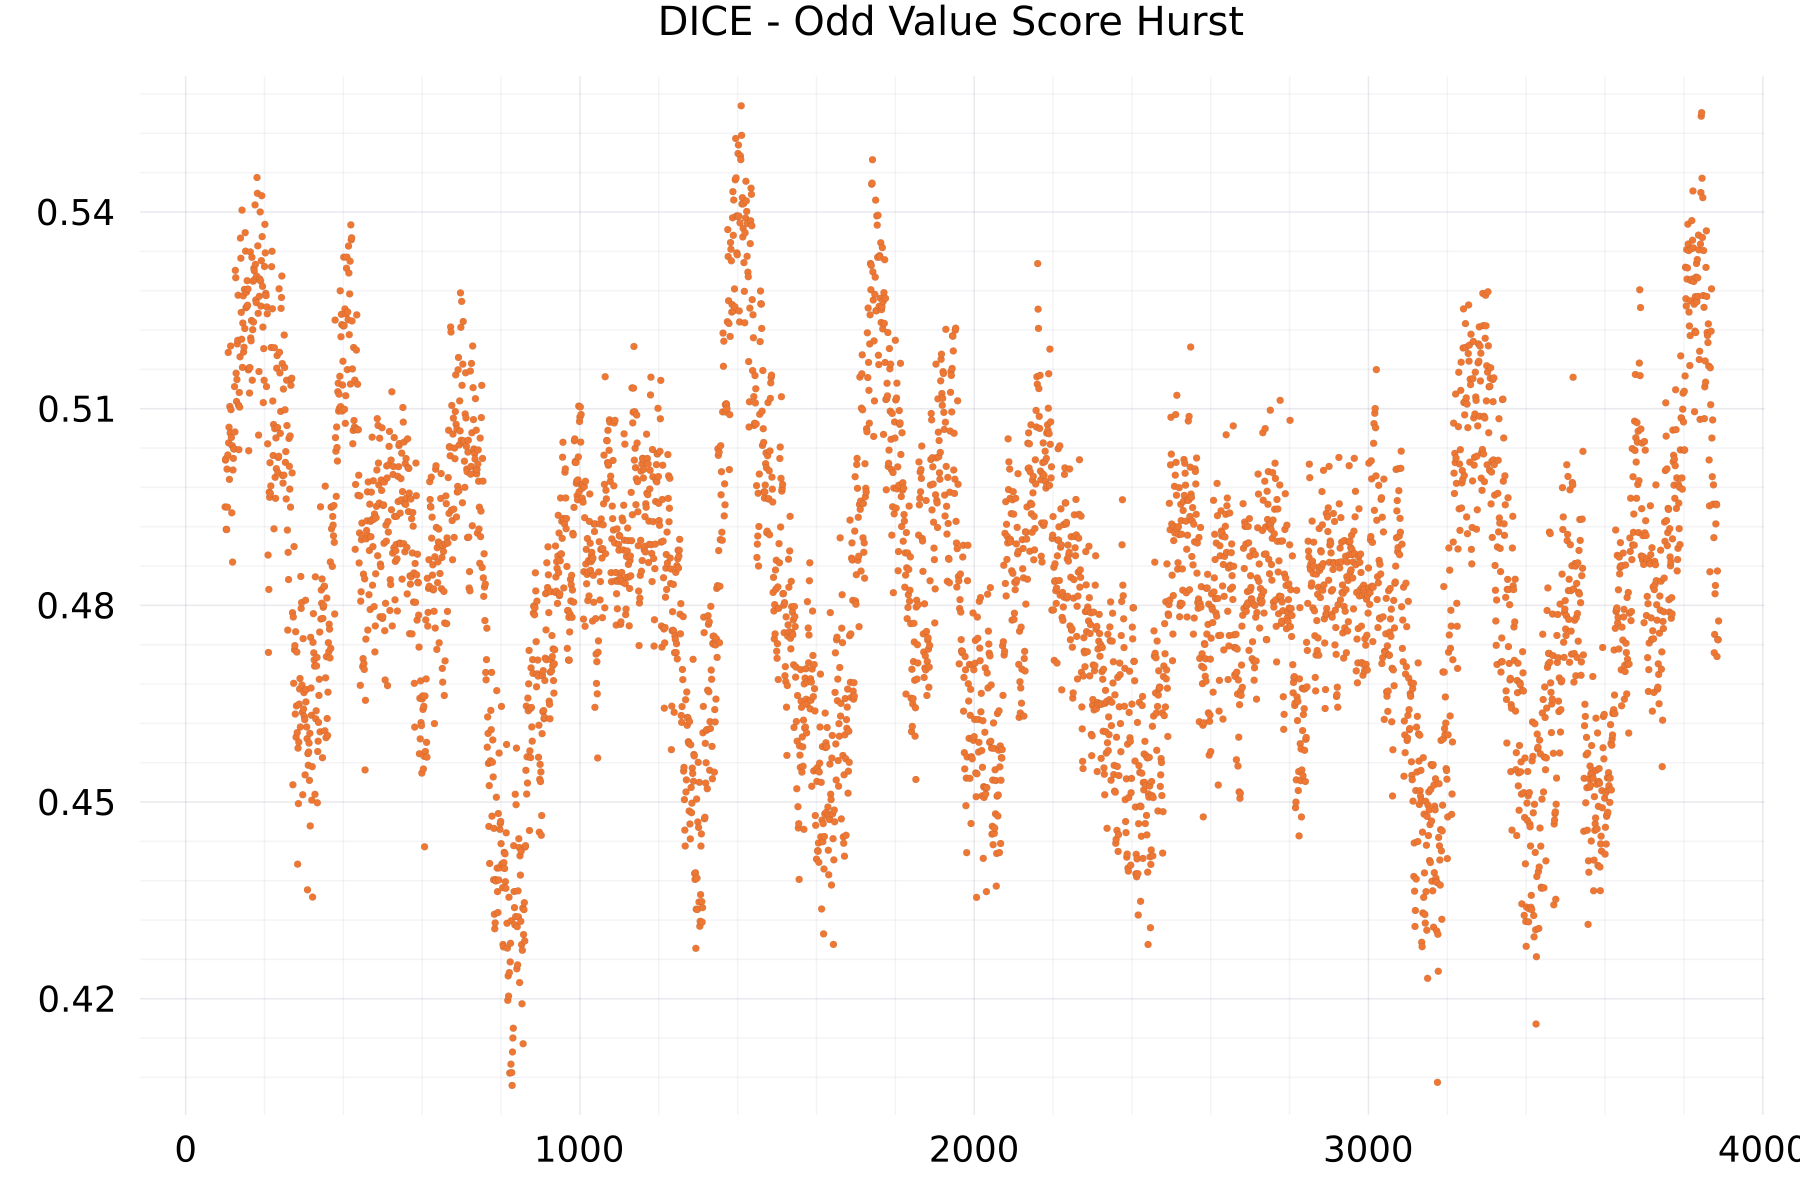
Odd Value Score Hurst Plots
The plot shows as example for the DICE alphabet the hurst exponent of the odd-valued scores.
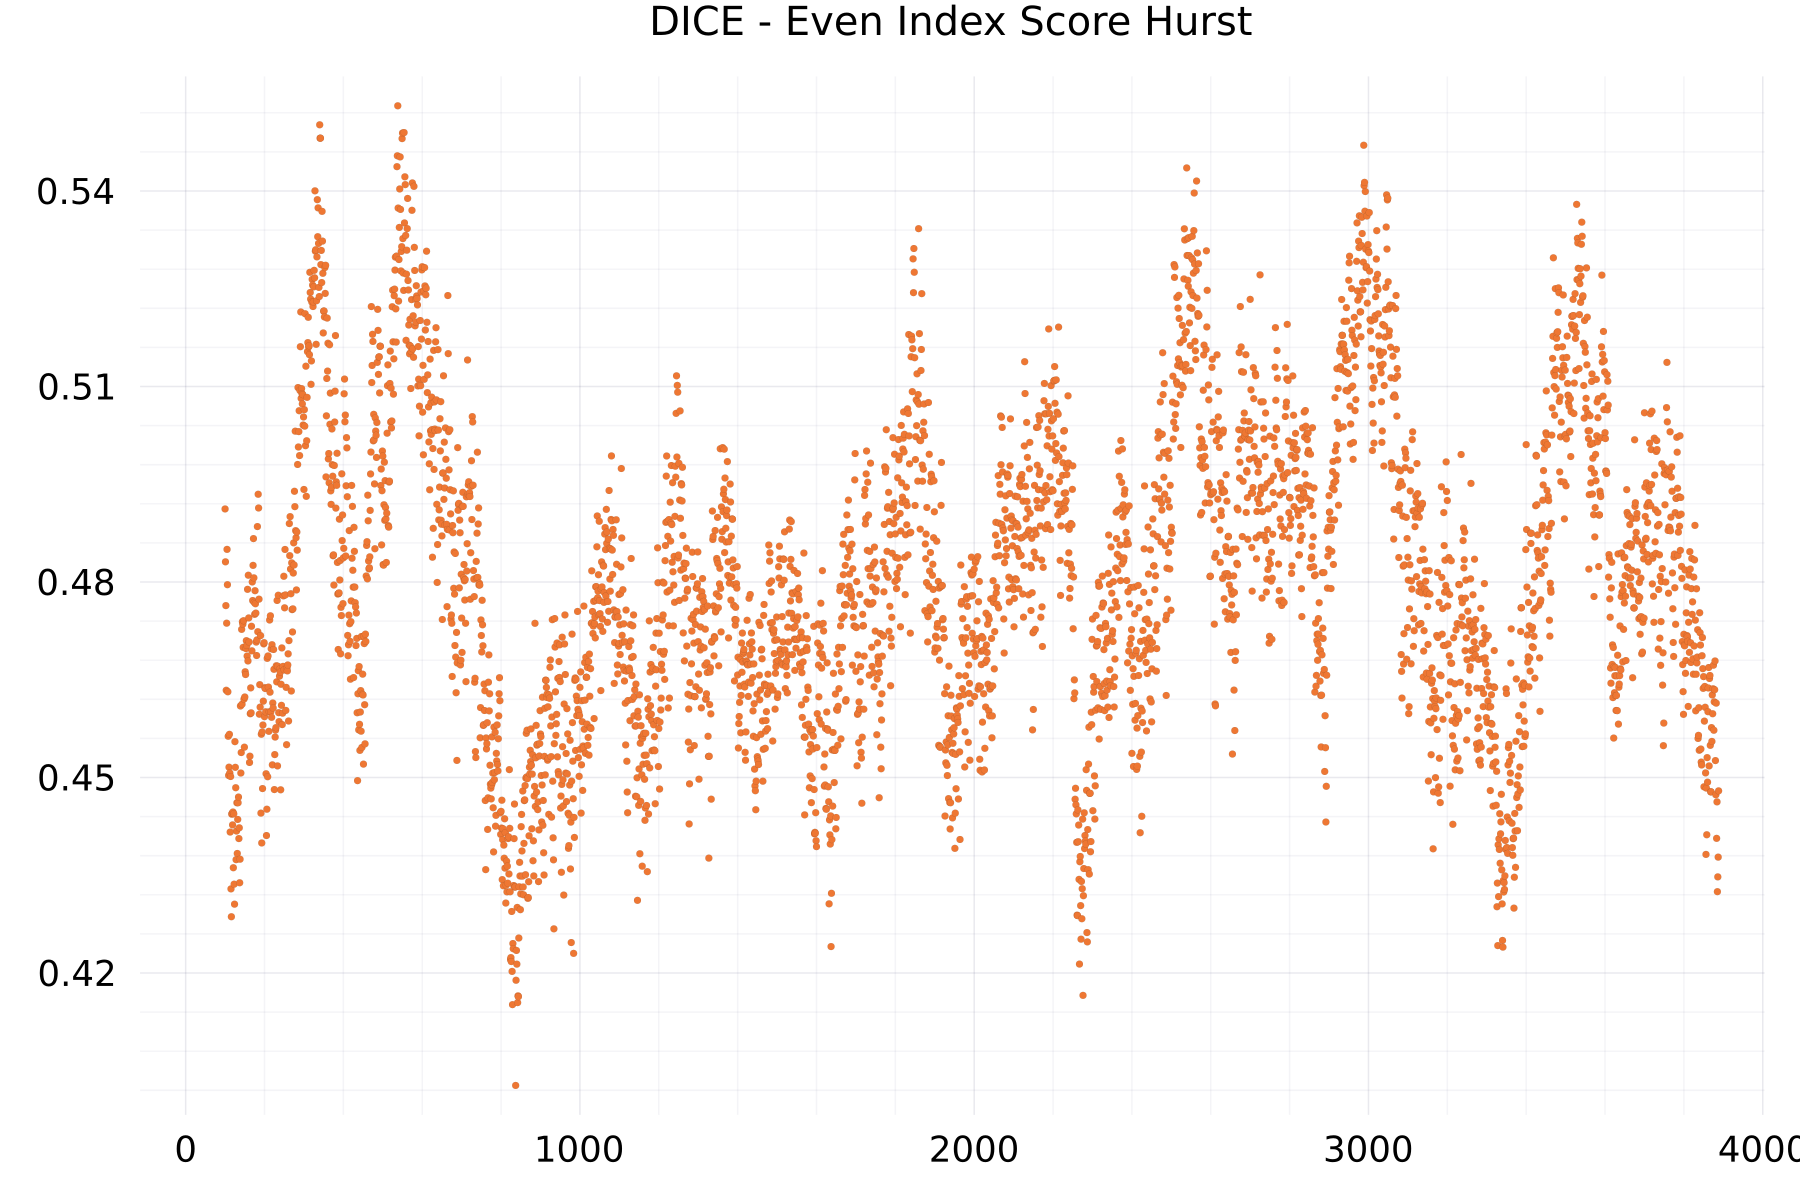
Even Index Score Hurst Plots
The plot shows as example for the DICE alphabet the hurst exponent of the even-indexed scores.
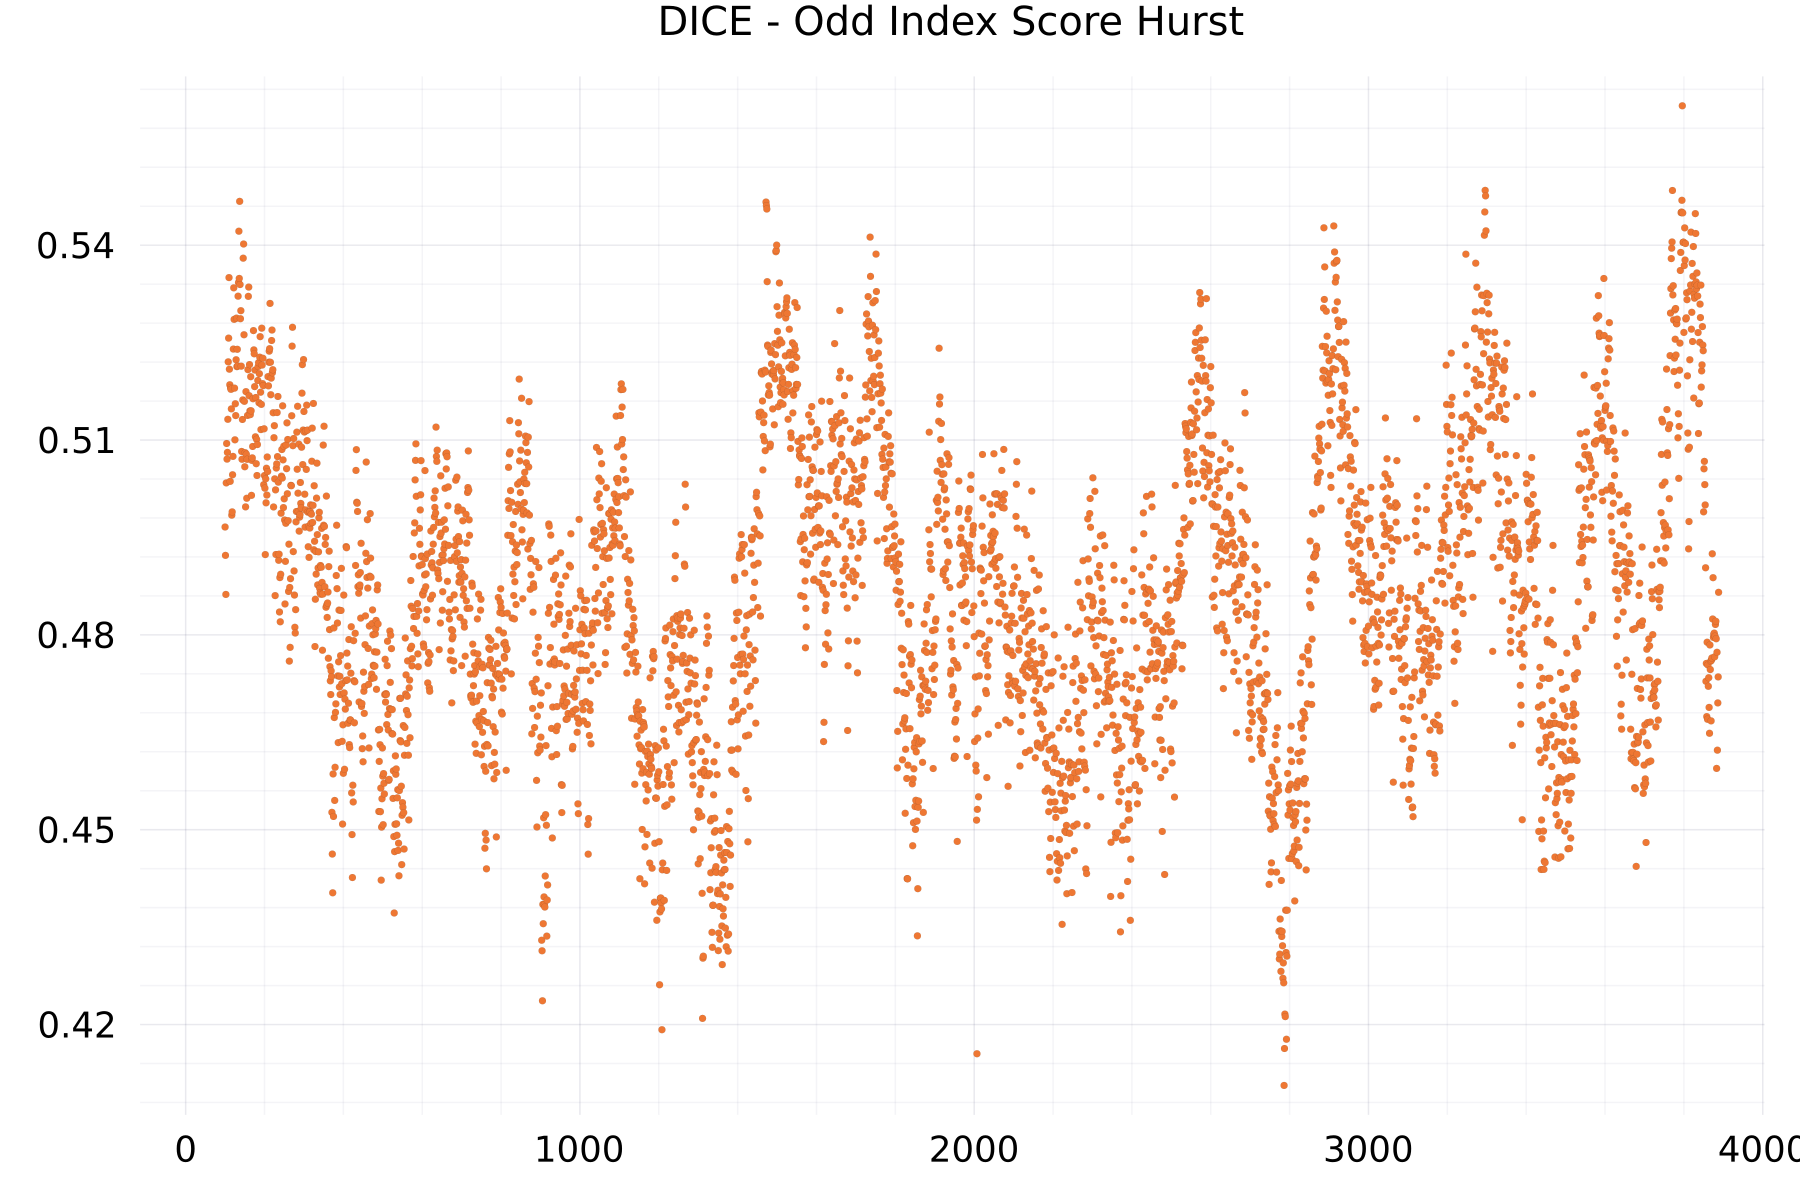
Odd Index Score Hurst Plots
The plot shows as example for the DICE alphabet the hurst exponent of the odd-indexed scores.
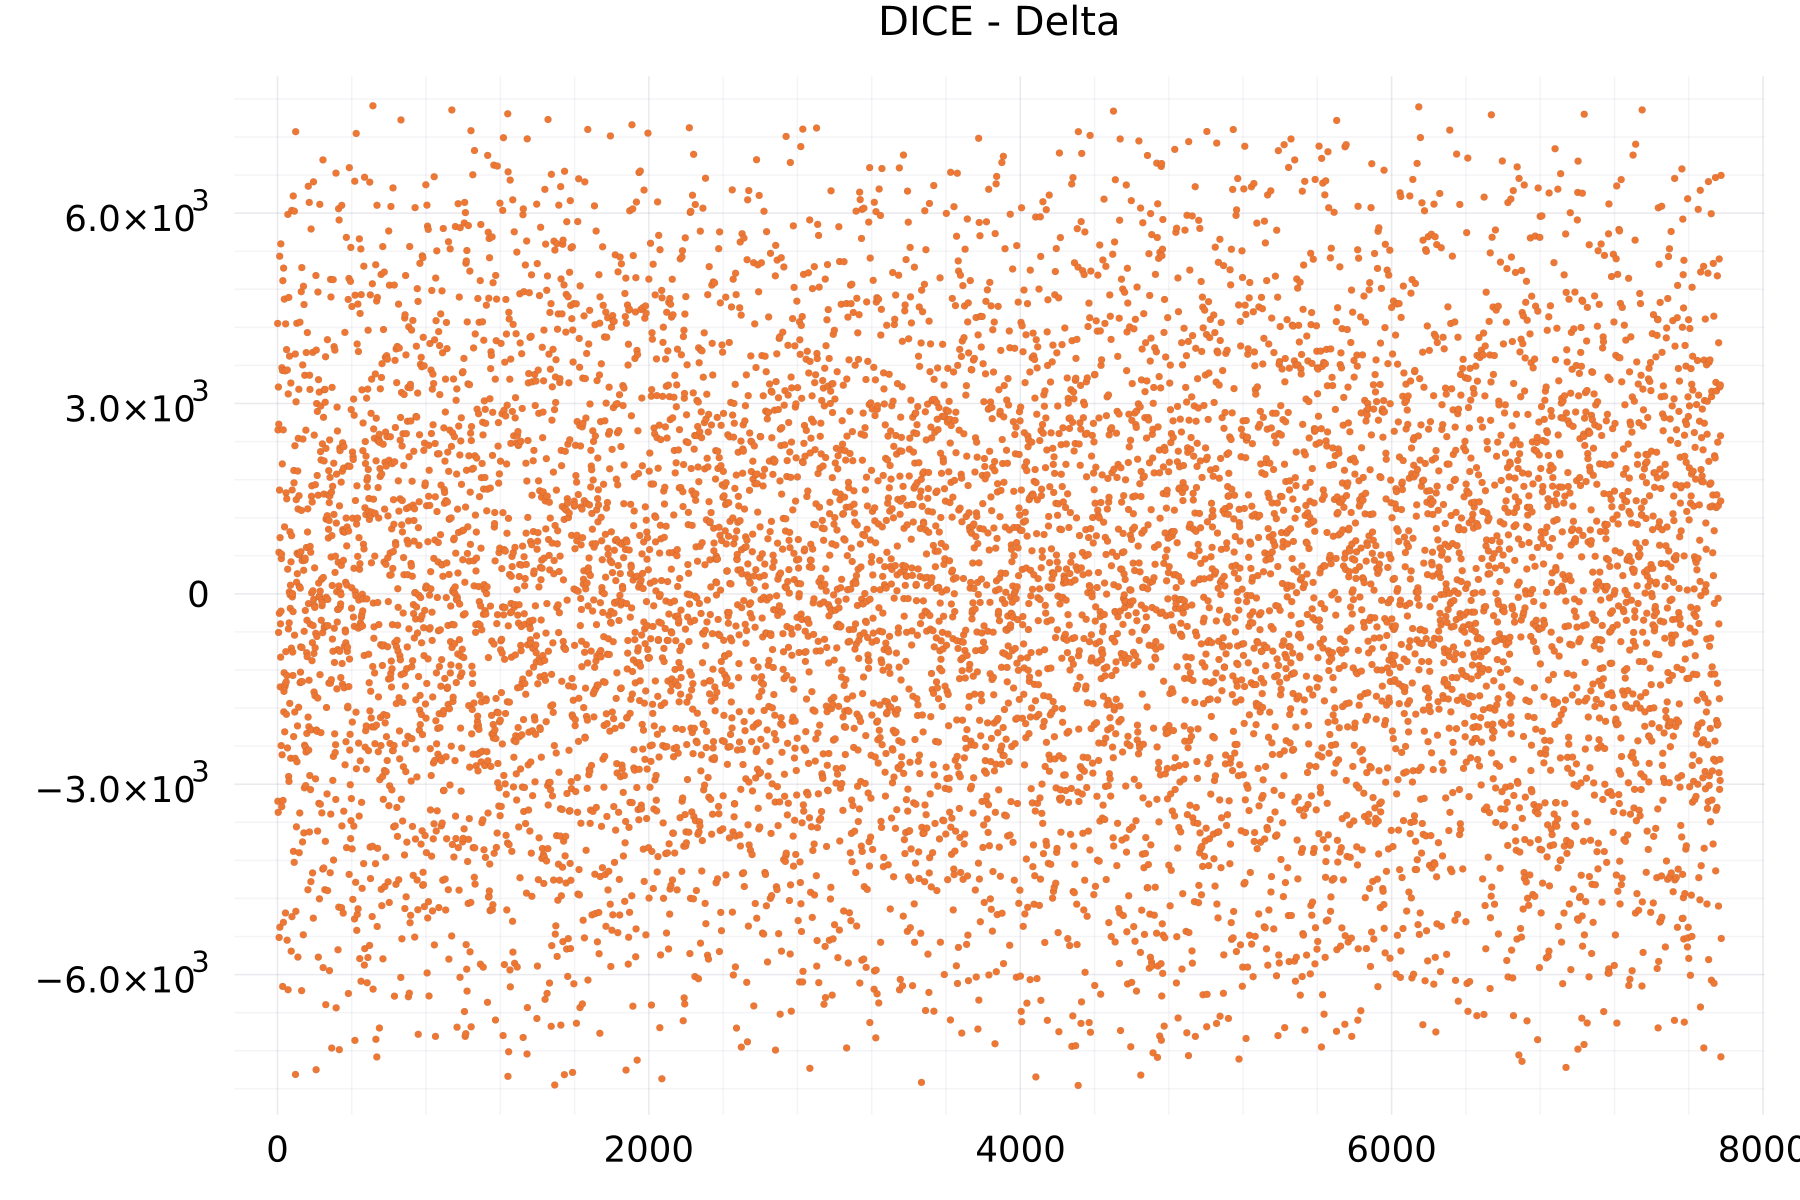
Delta Plots
The plot shows as example for the DICE alphabet the one-step differences of 7,776 scores.
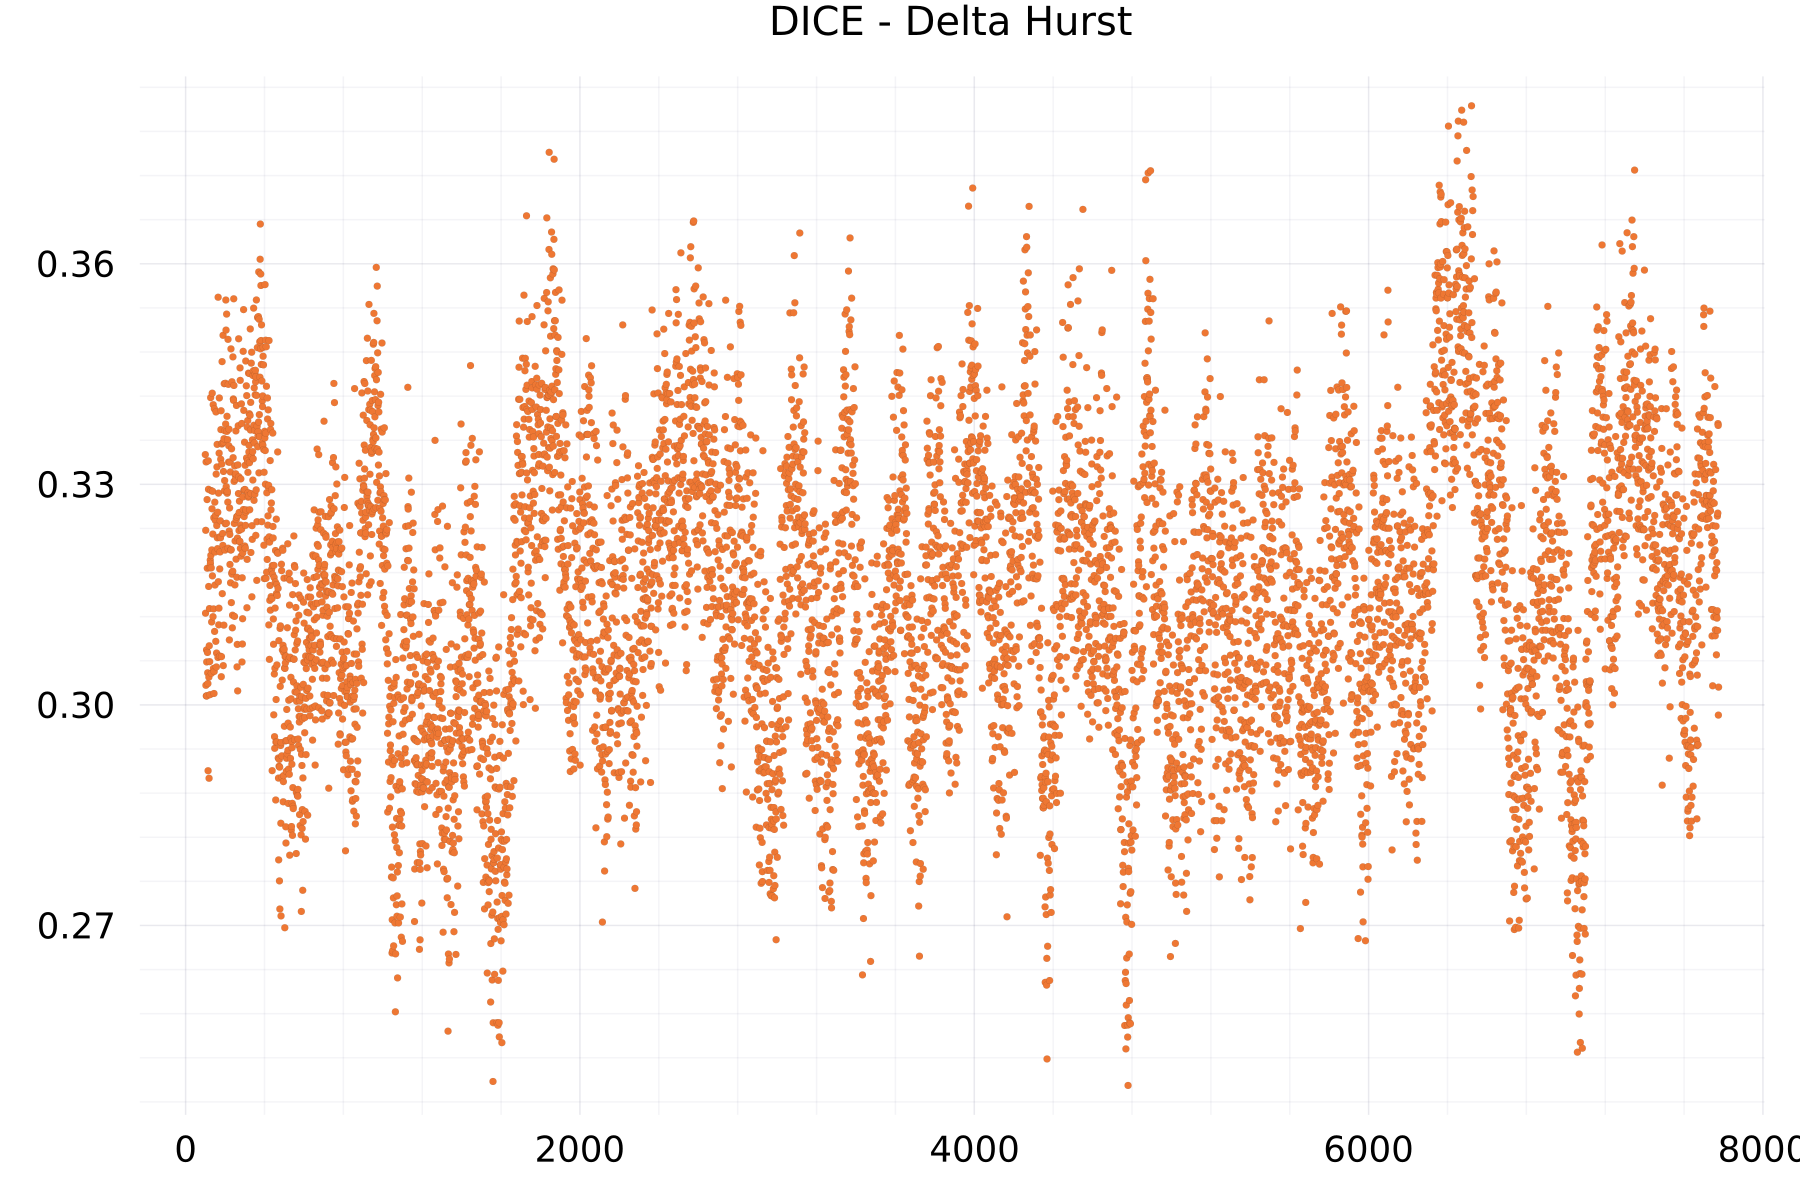
Delta Hurst Plots
The plot shows as example for the DICE alphabet the hurst exponent of the one-step differences of 7,776 scores.
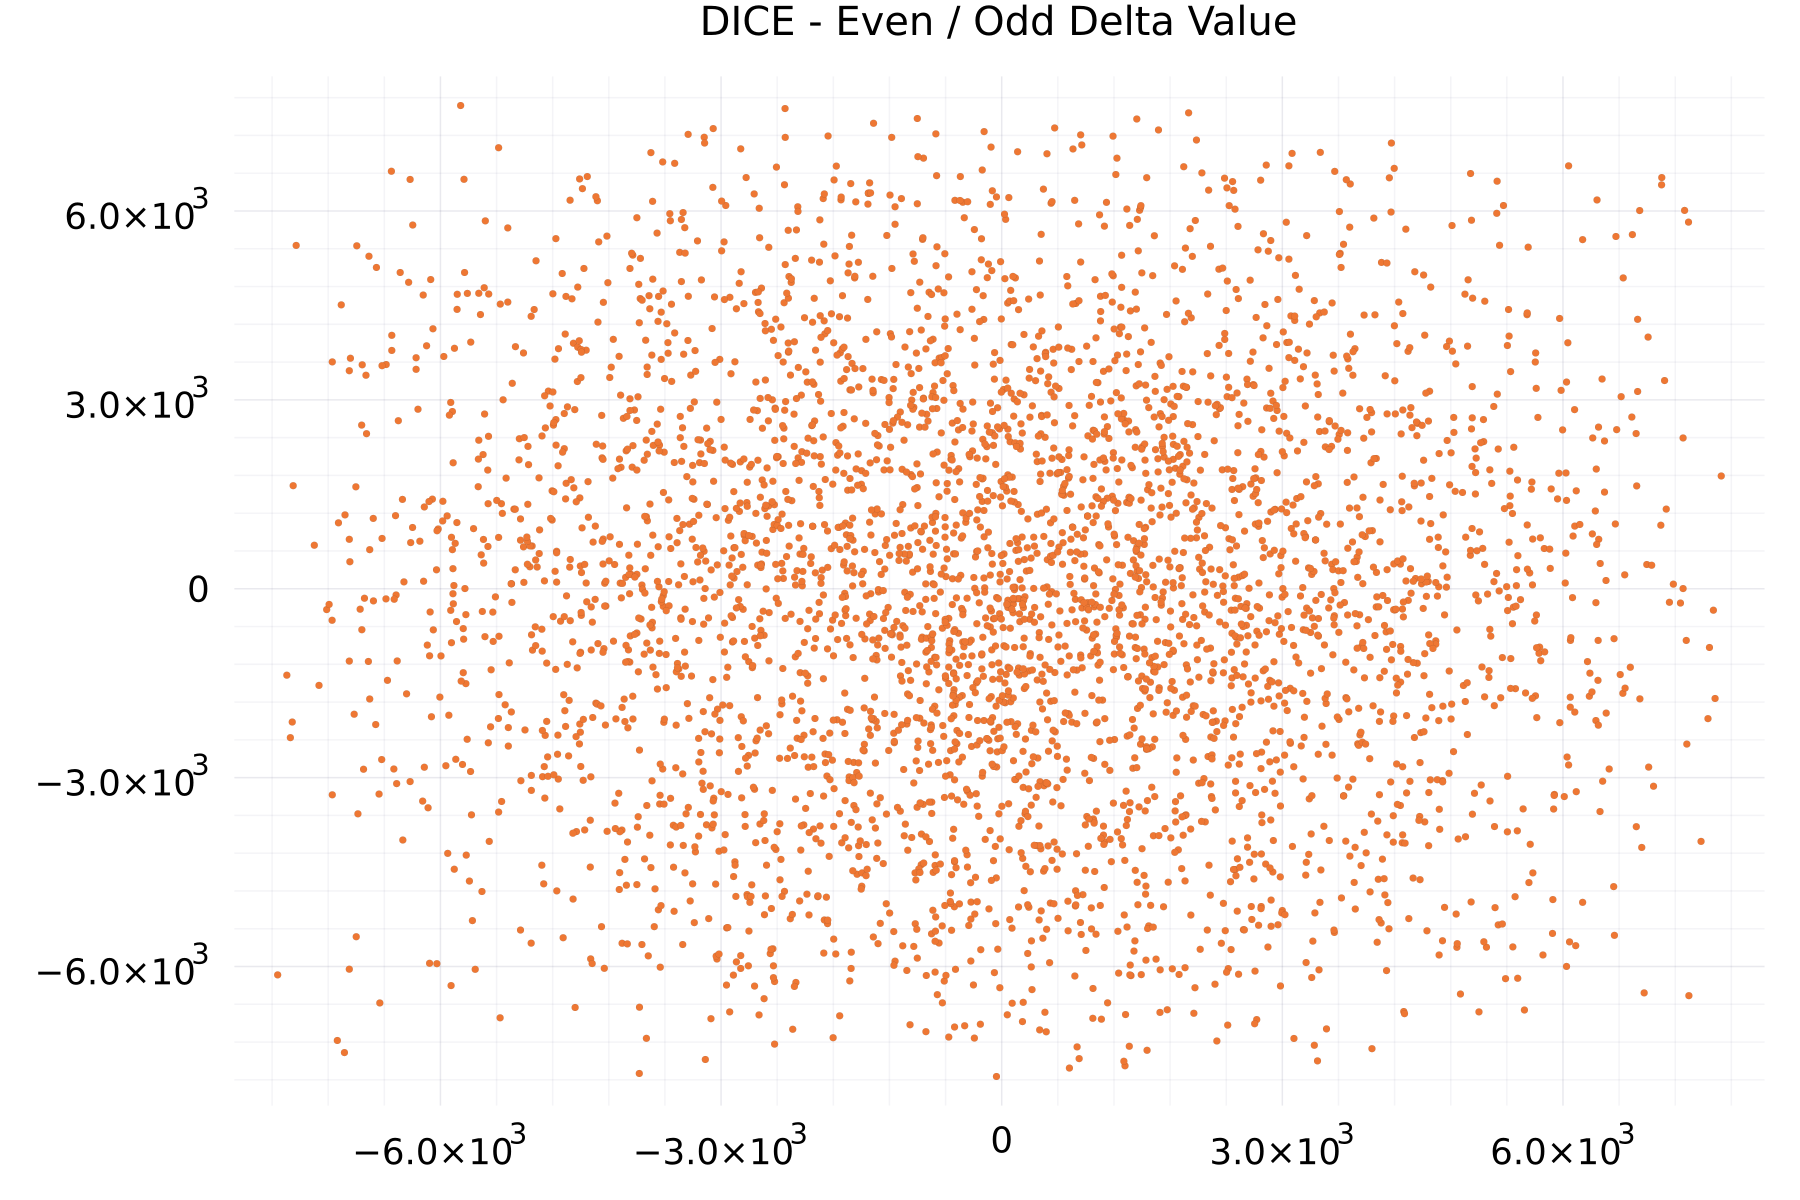
Even / Odd Delta Value Plots
The plot shows as example for the DICE alphabet the even- versus odd-values of 7,775 deltas.
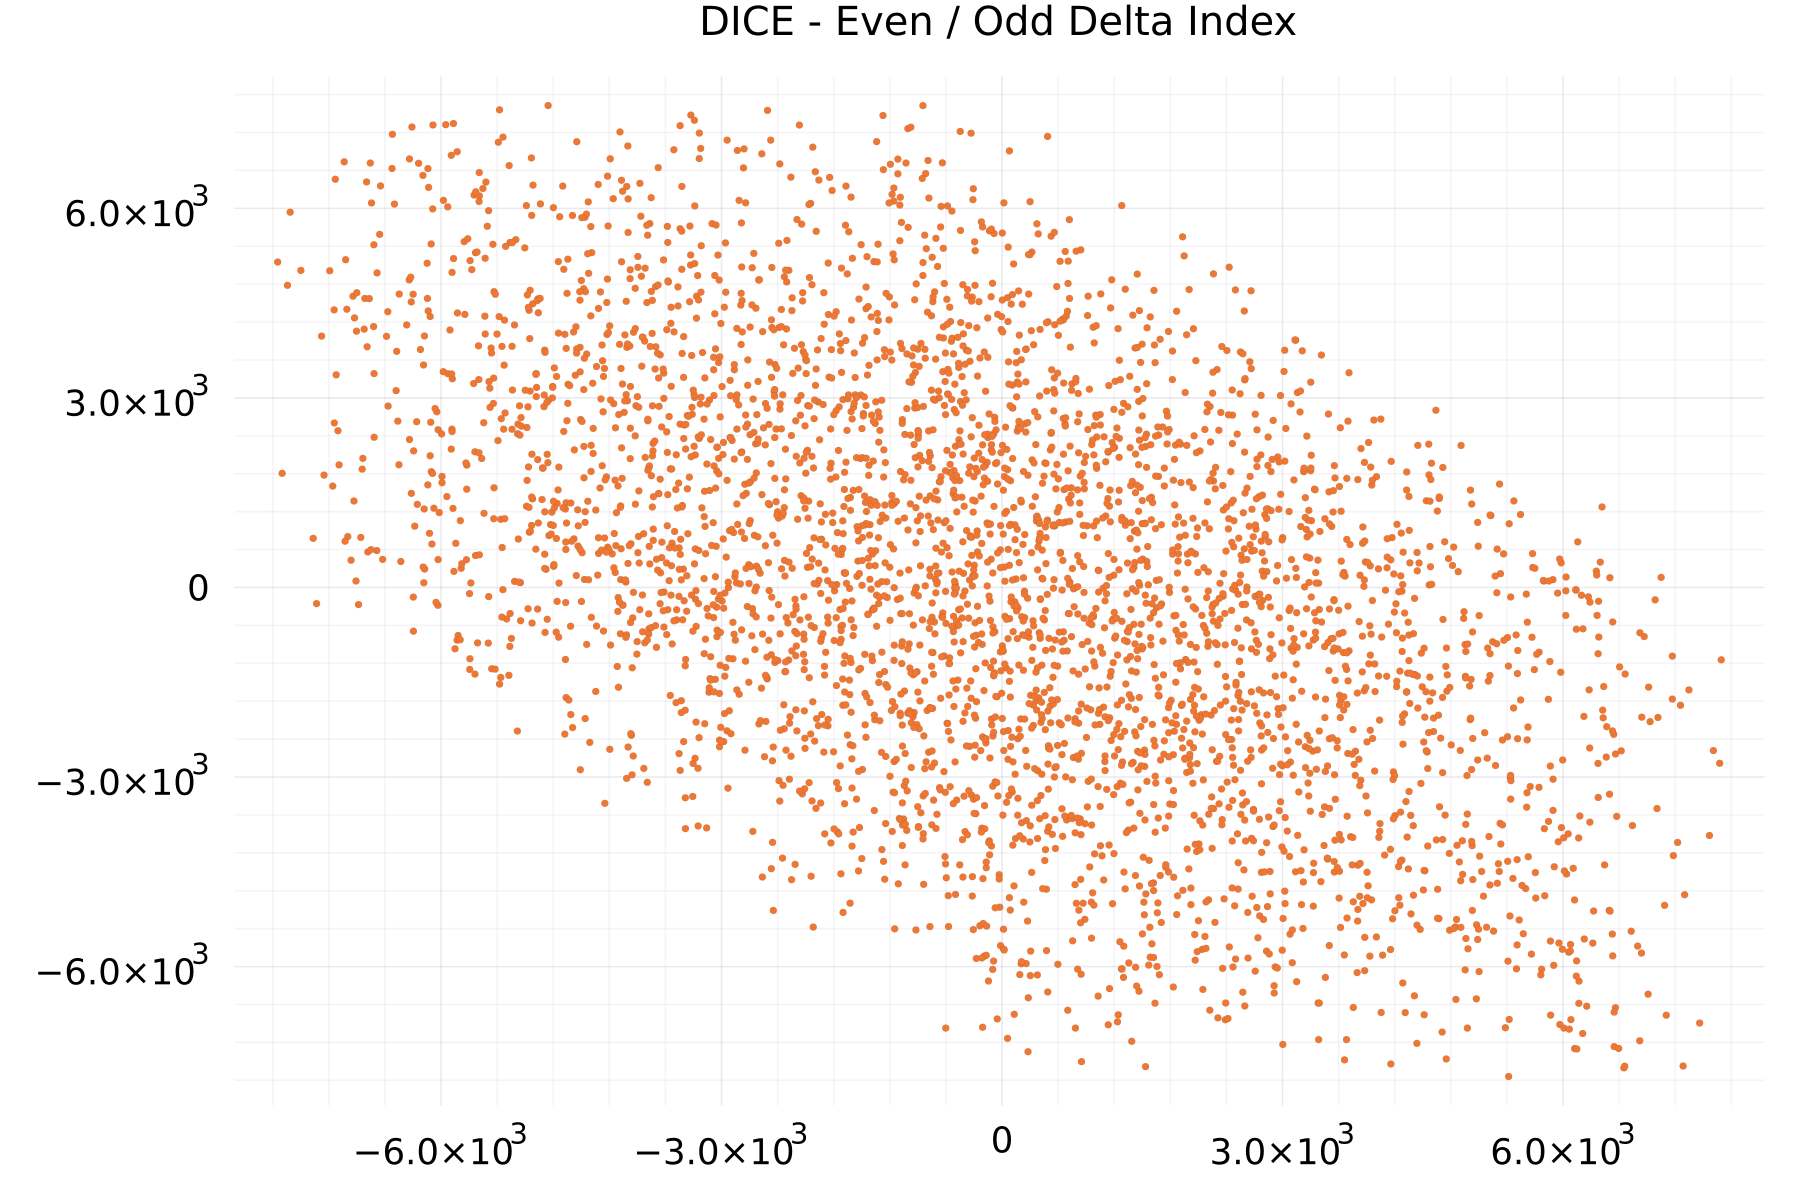
Even / Odd Delta Index Plots
The plot shows as example for the DICE alphabet the deltas at the even- versus odd-indexes.
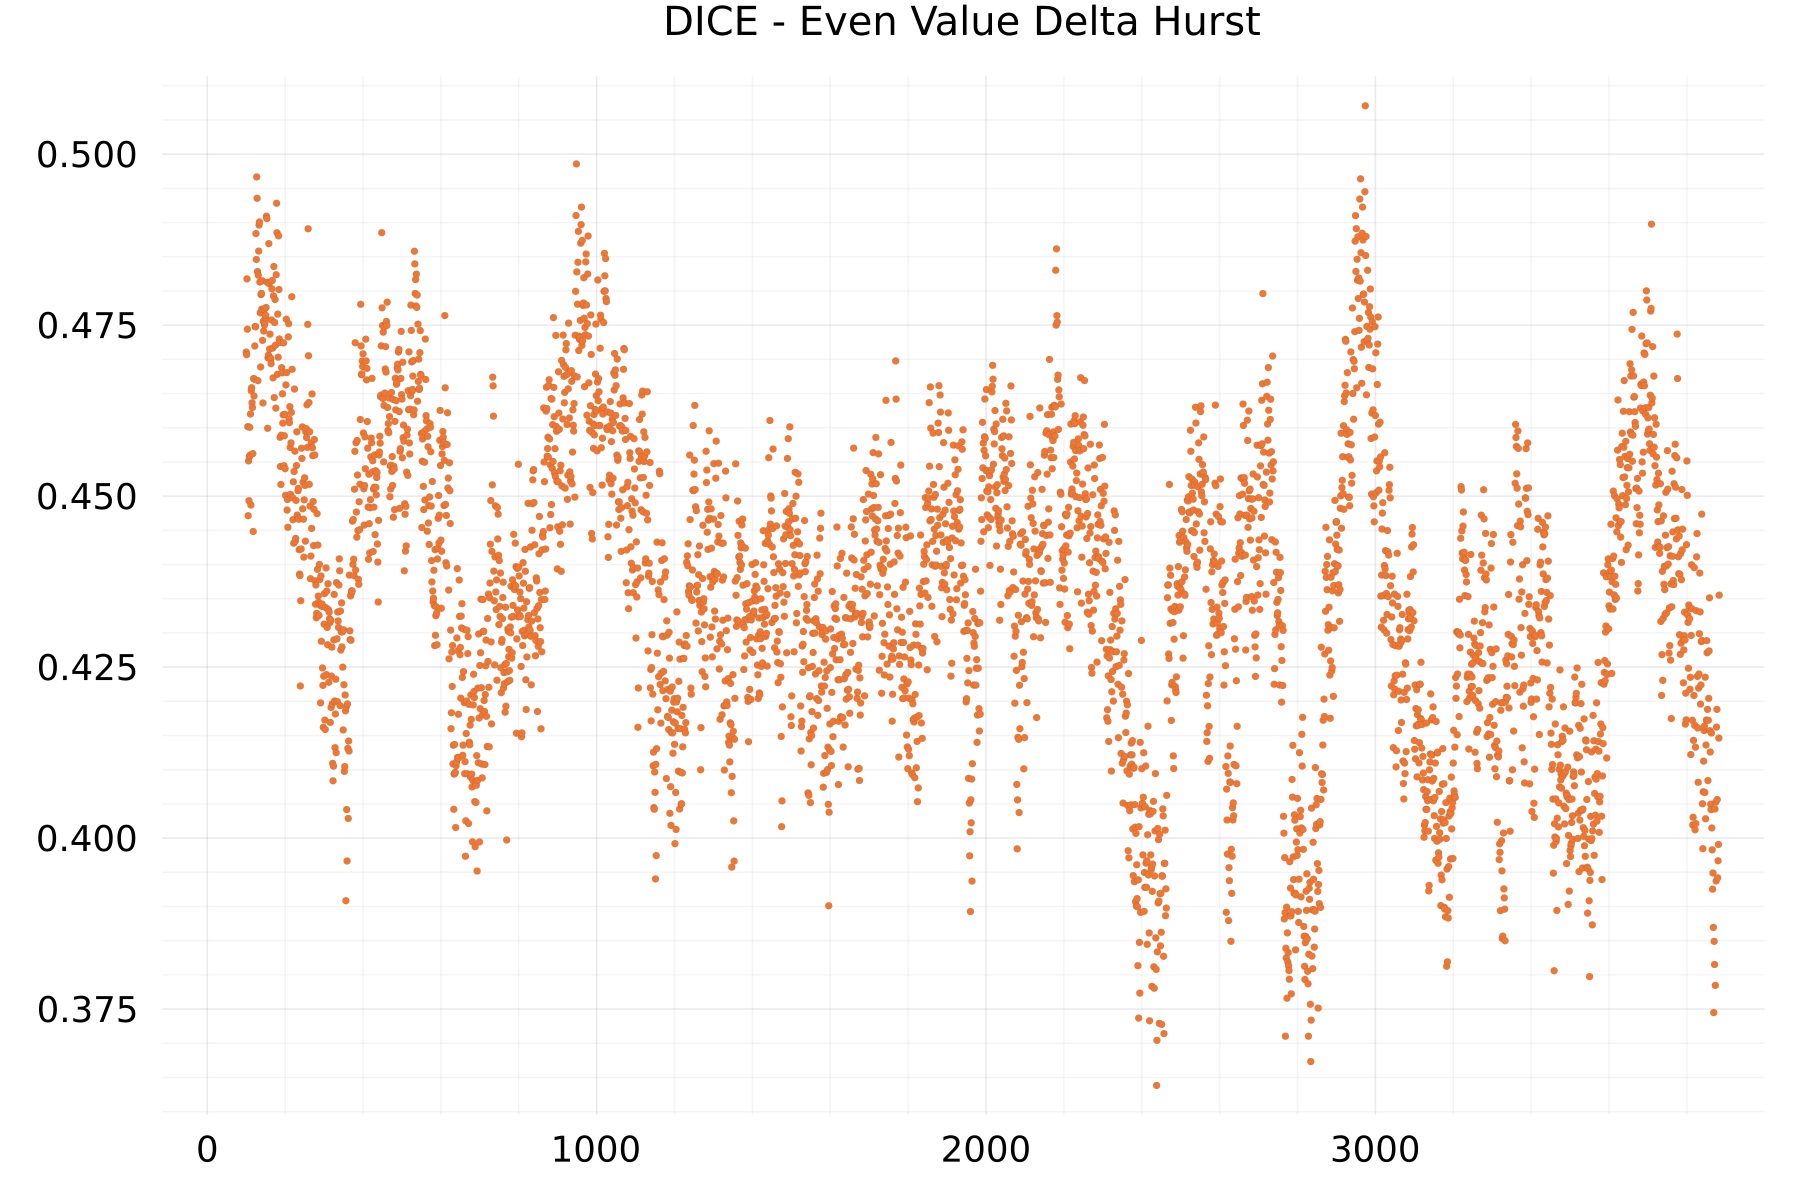
Even Value Delta Hurst Plots
The plot shows as example for the DICE alphabet the hurst exponent of the even-valued deltas.
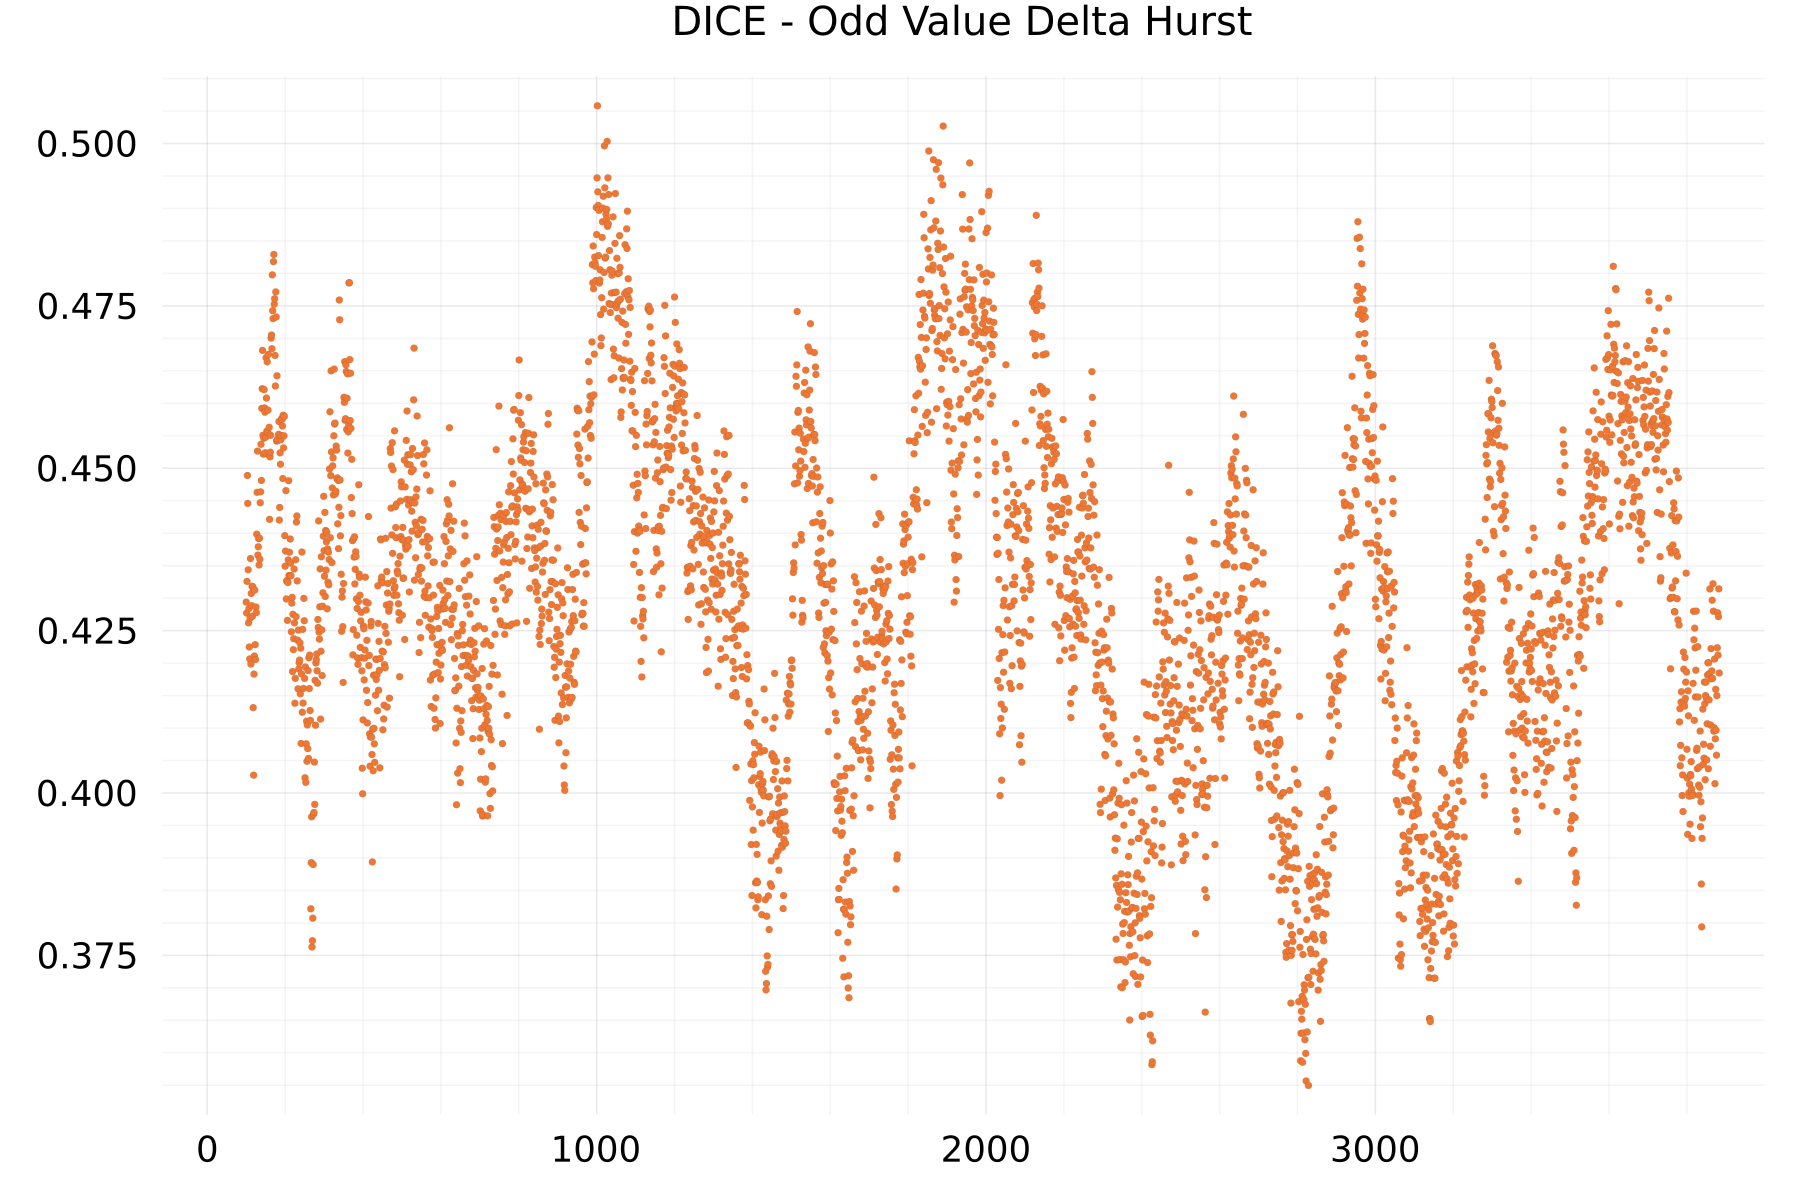
Odd Value Delta Hurst Plots
The plot shows as example for the DICE alphabet the hurst exponent of the odd-valued deltas.
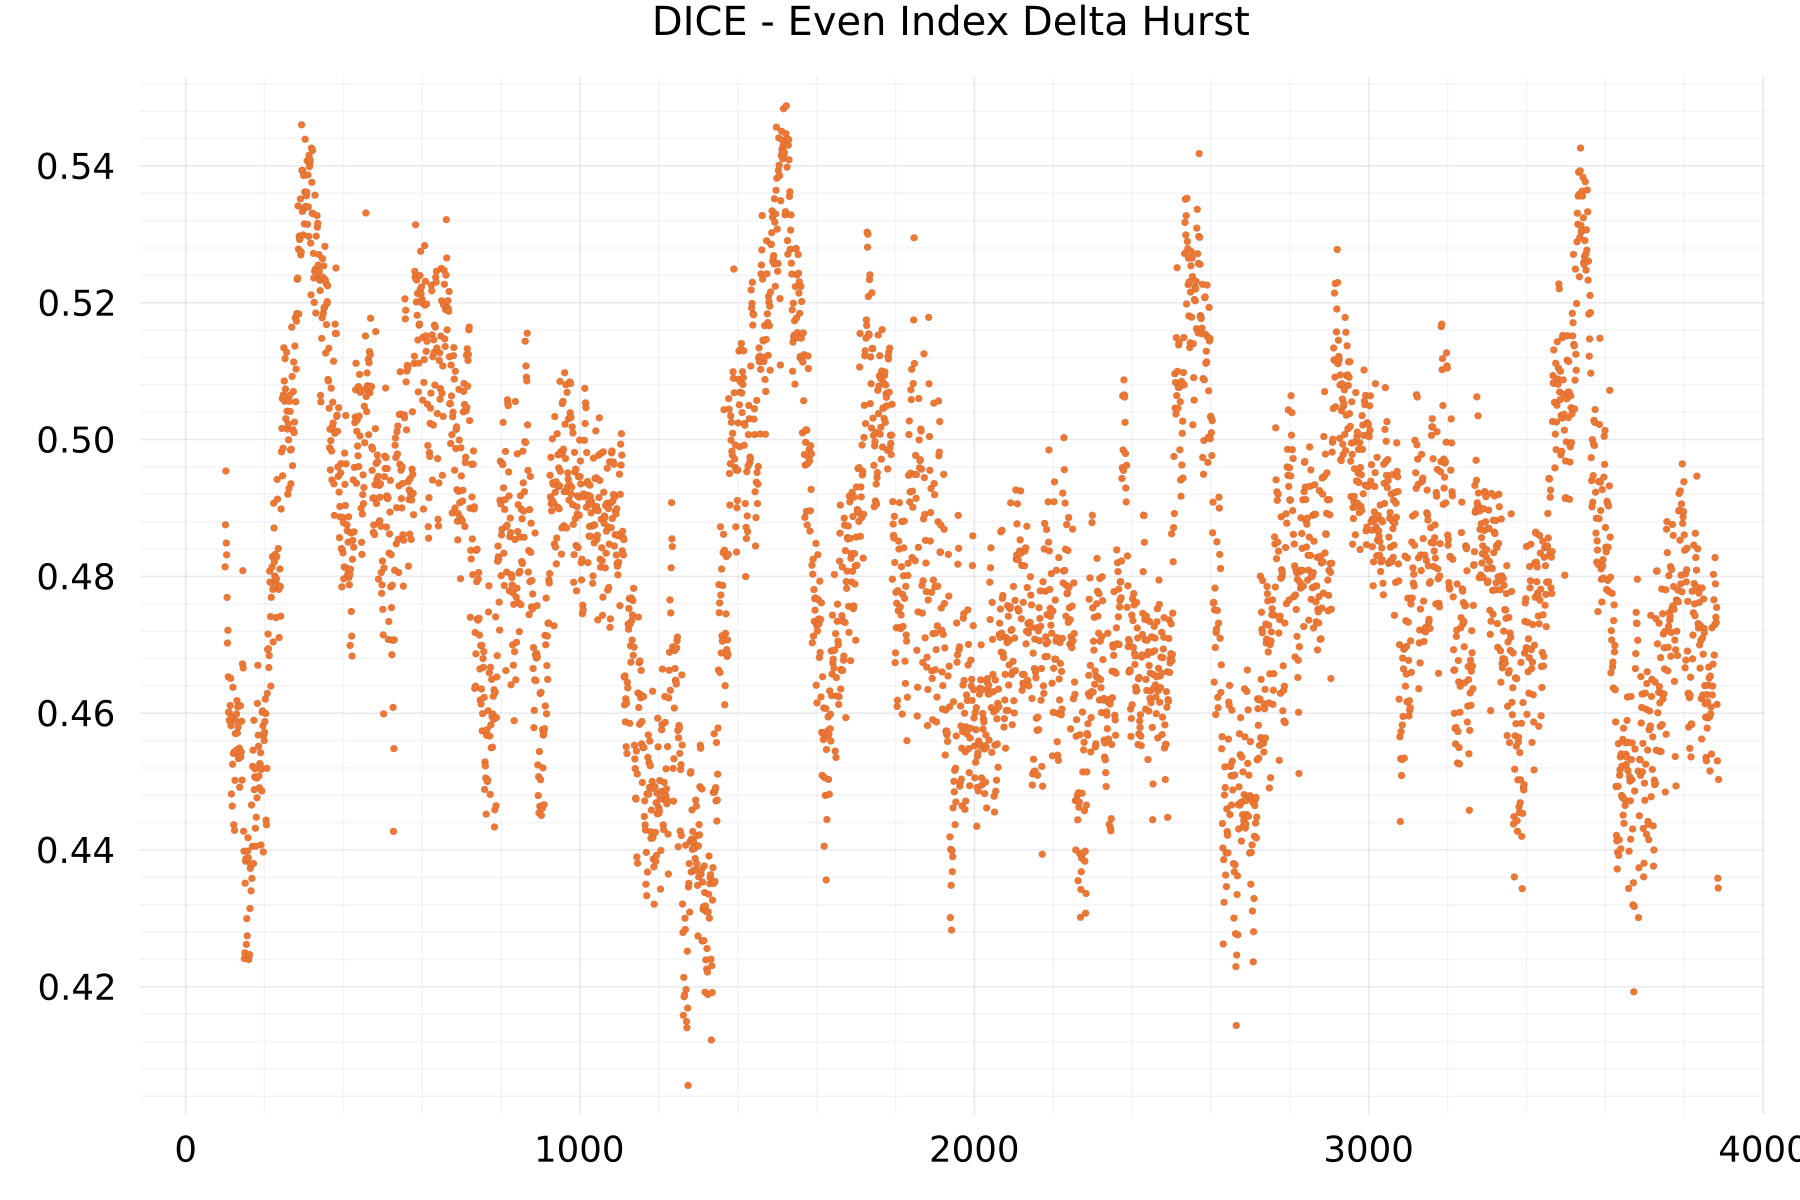
Even Index Delta Hurst Plots
The plot shows as example for the DICE alphabet the hurst exponent of the even-indexed deltas.
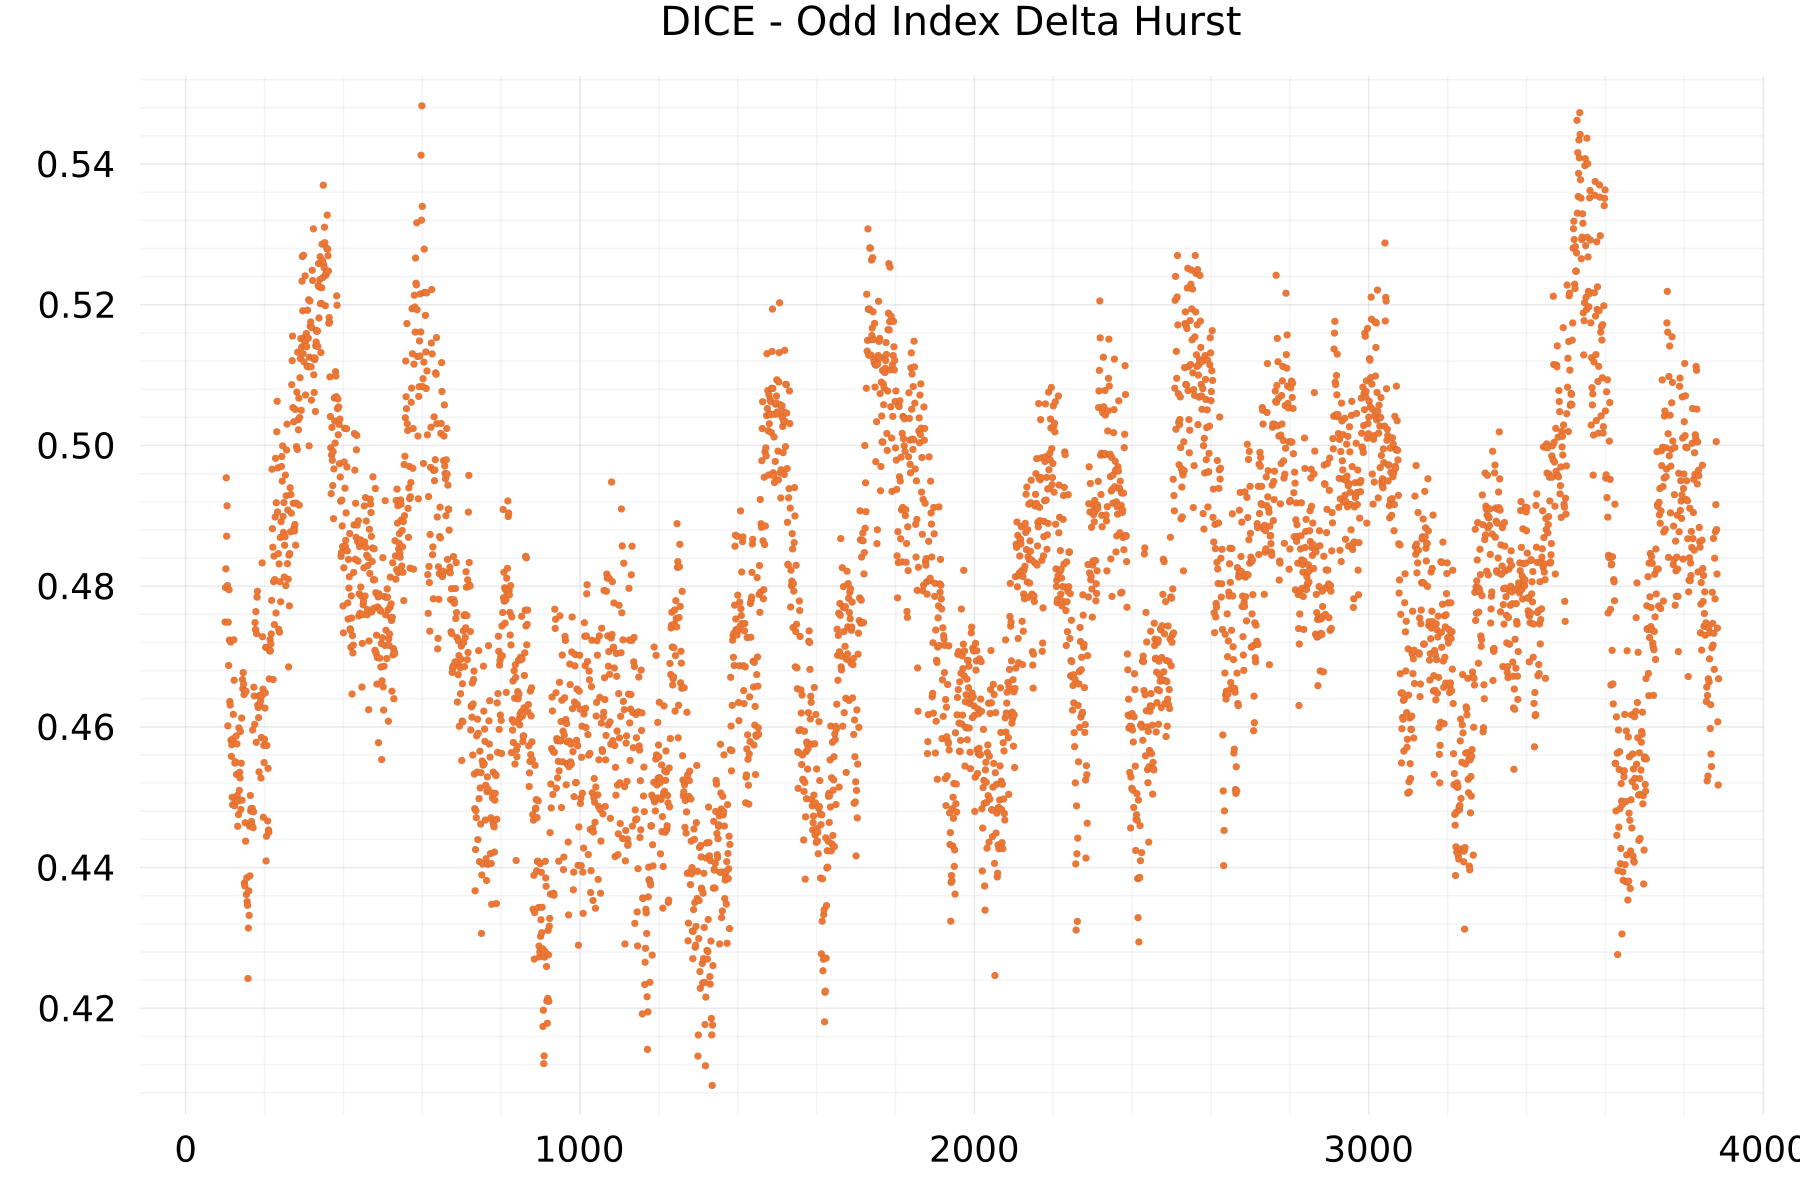
Odd Index Delta Hurst Plots
The plot shows as example for the DICE alphabet the hurst exponent of the odd-indexed deltas.
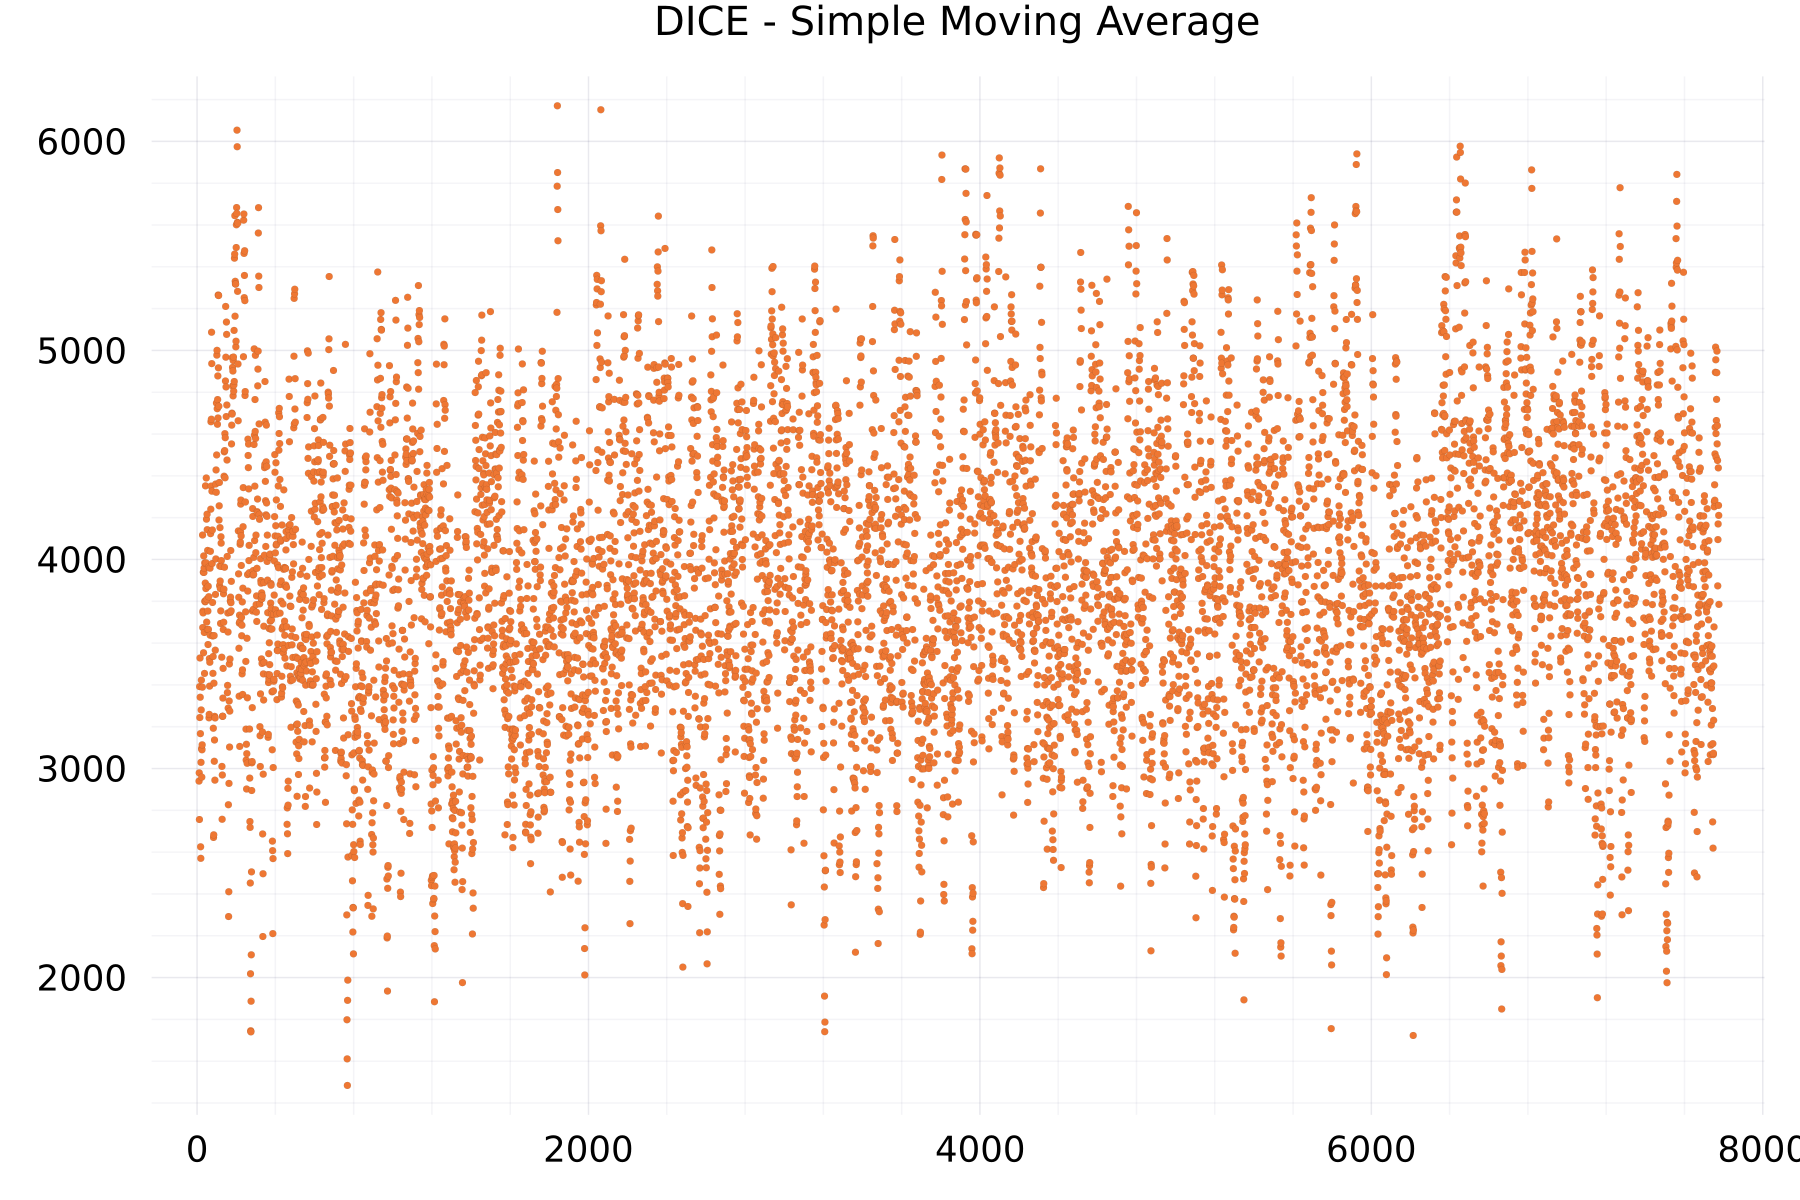
Simple Moving Average Plots
The plot shows as example for the DICE alphabet the moving average of 7,776 scores.
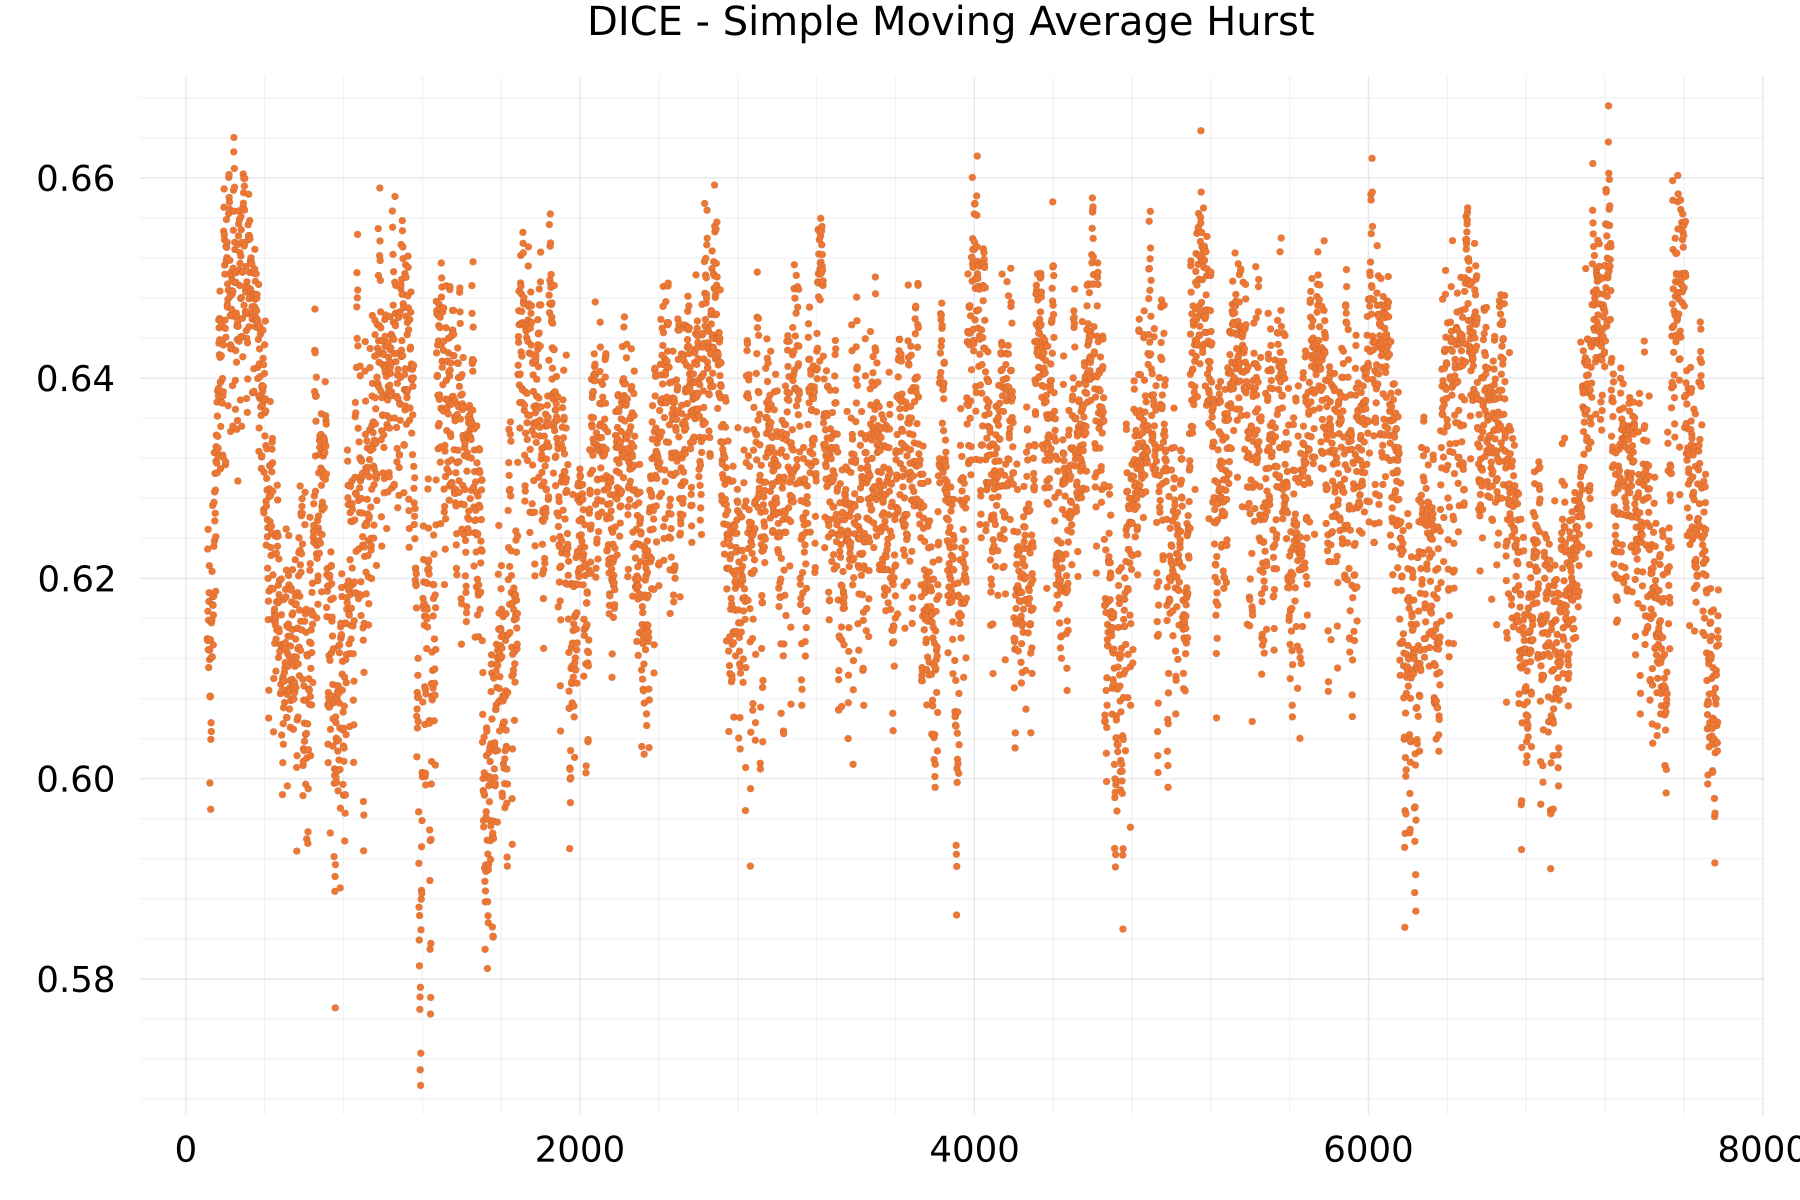
Simple Moving Average Hurst Plots
The plot shows as example for the DICE alphabet the hurst exponent of the moving average of 7,776 scores.
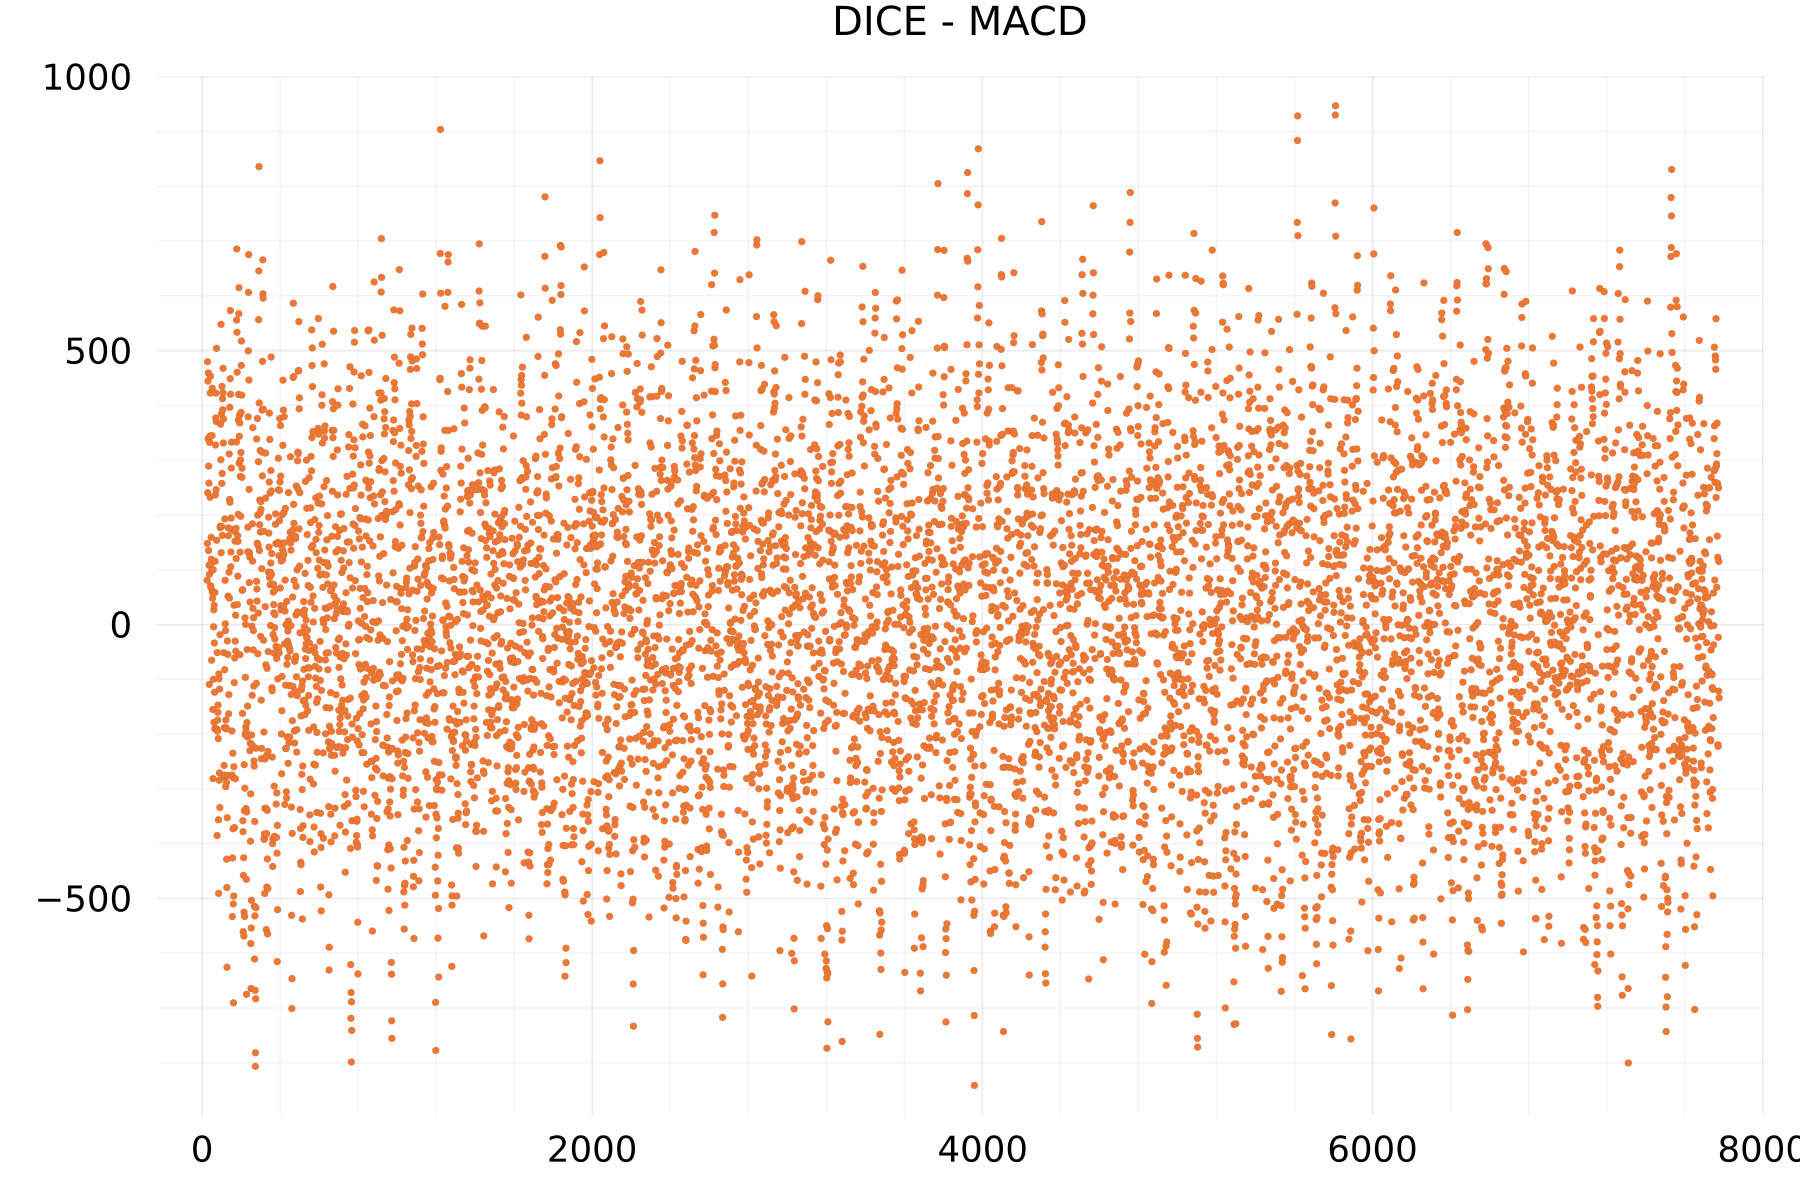
MACD Plots
The plot shows as example for the DICE alphabet the moving average convergence divergence of 7,776 scores.
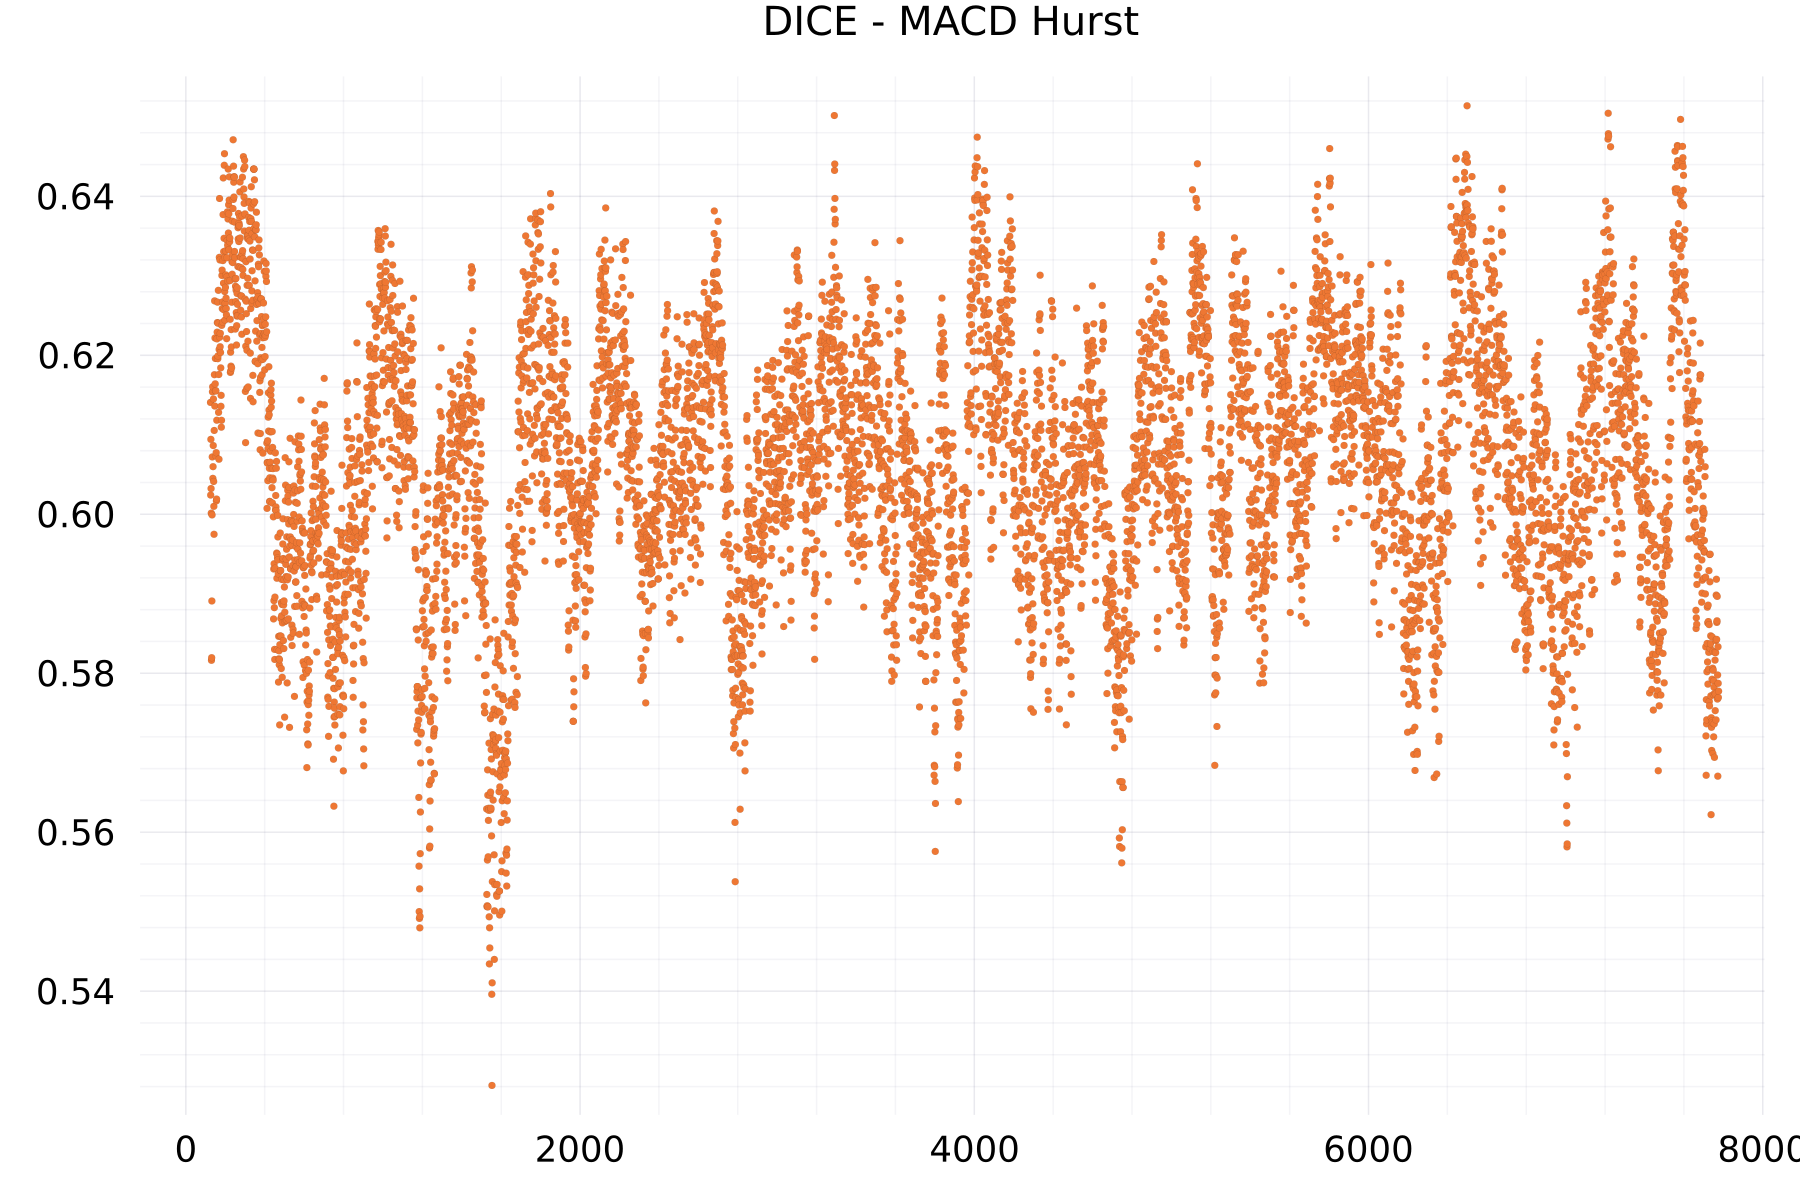
MACD Hurst Plots
The plot shows as example for the DICE alphabet the hurst exponent of the moving average convergence divergence of 7,776 scores.
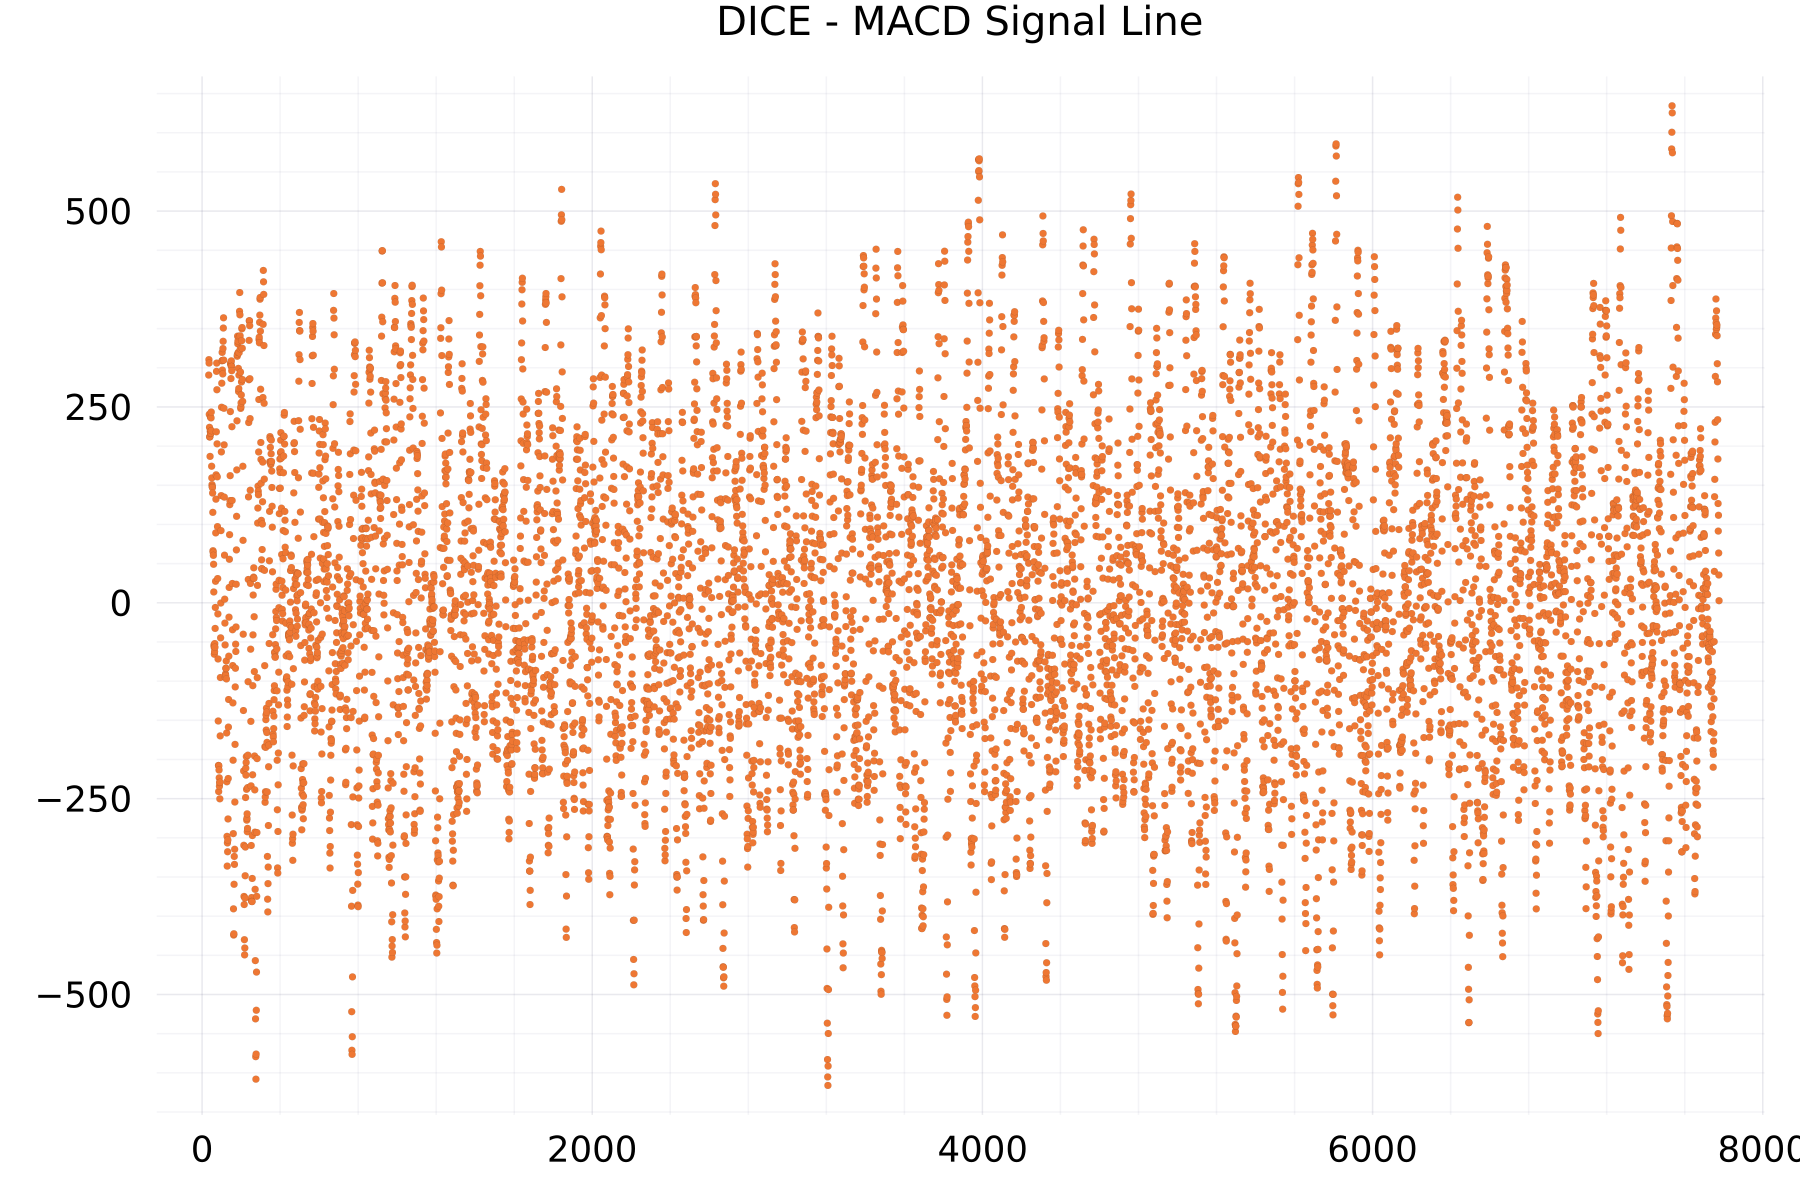
MACD Signal Line Plots
The plot shows as example for the DICE alphabet the signal line of the moving average convergence divergence of 7,776 scores.
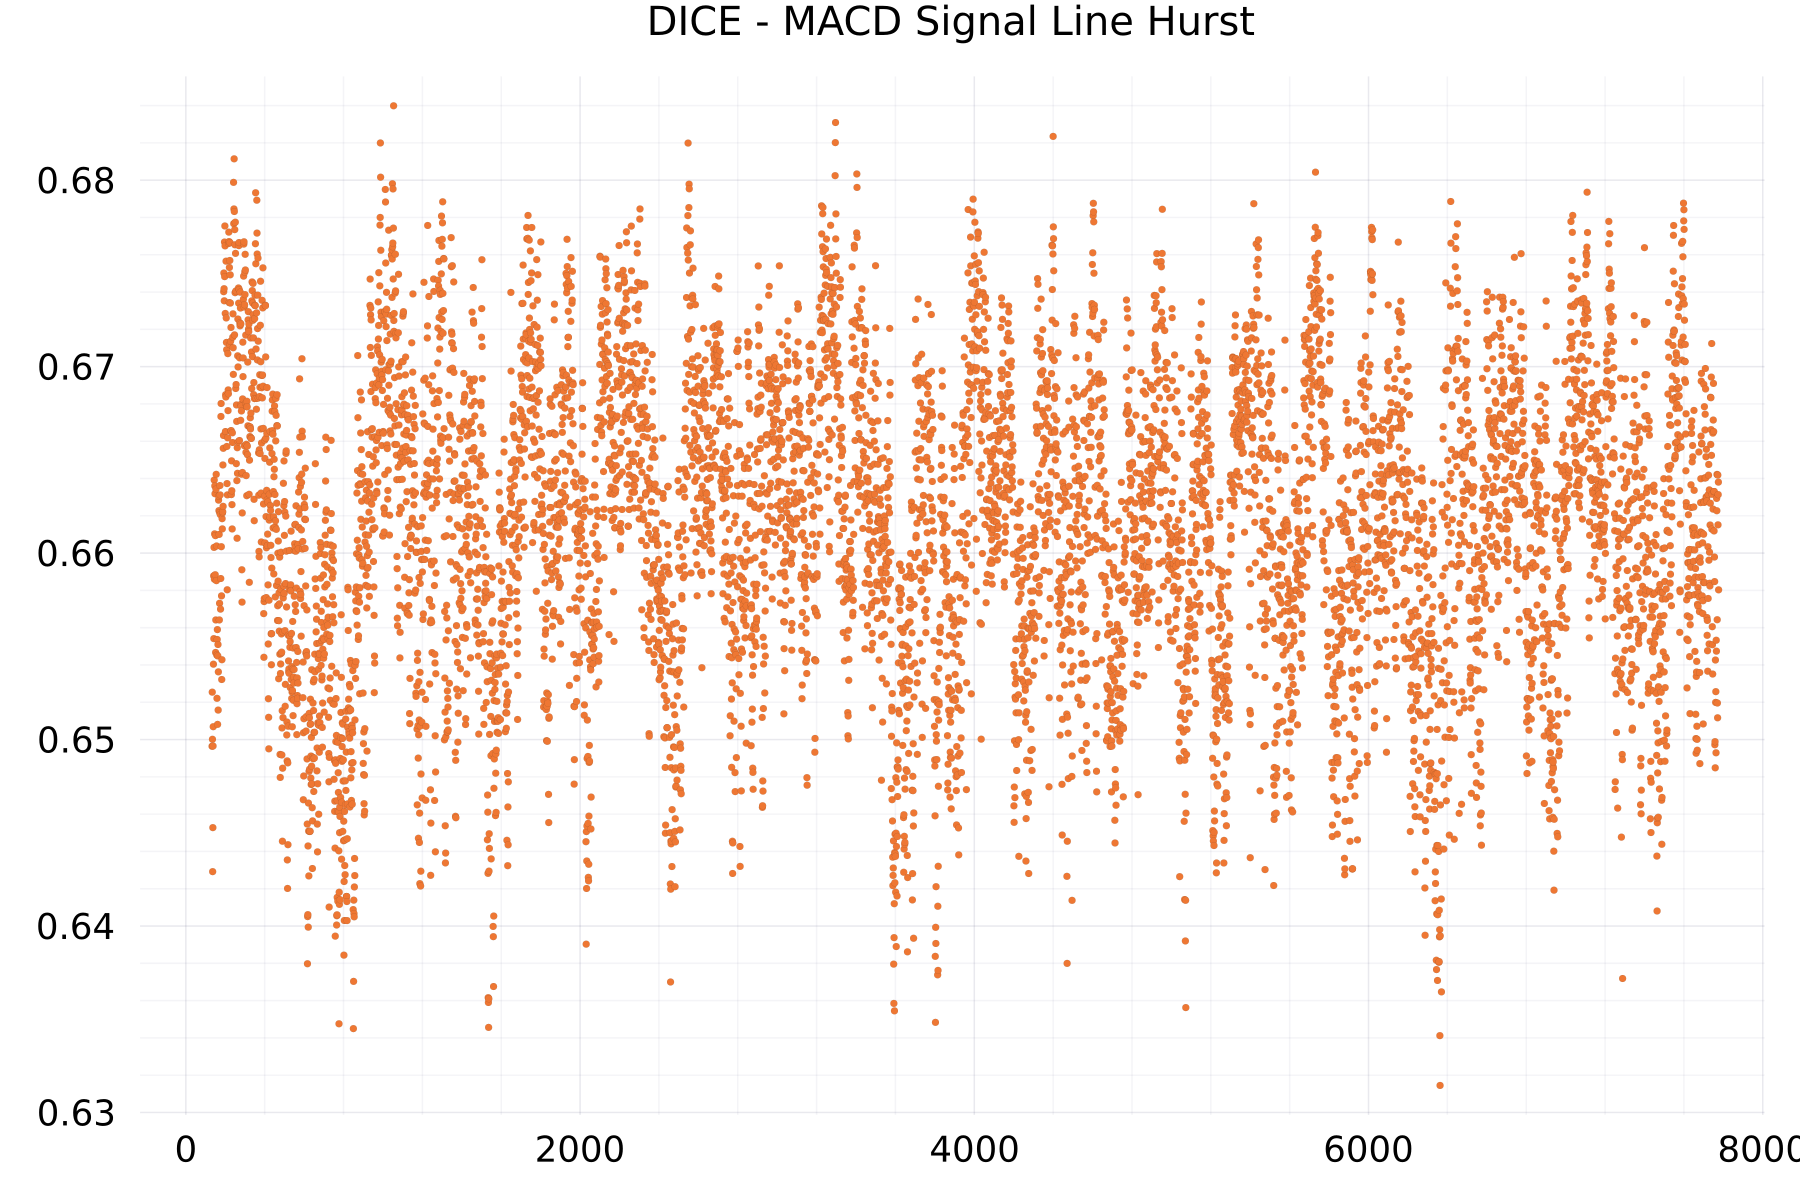
MACD Signal Line Hurst Plots
The plot shows as example for the DICE alphabet the hurst exponent of the signal line of the moving average convergence divergence of 7,776 scores.
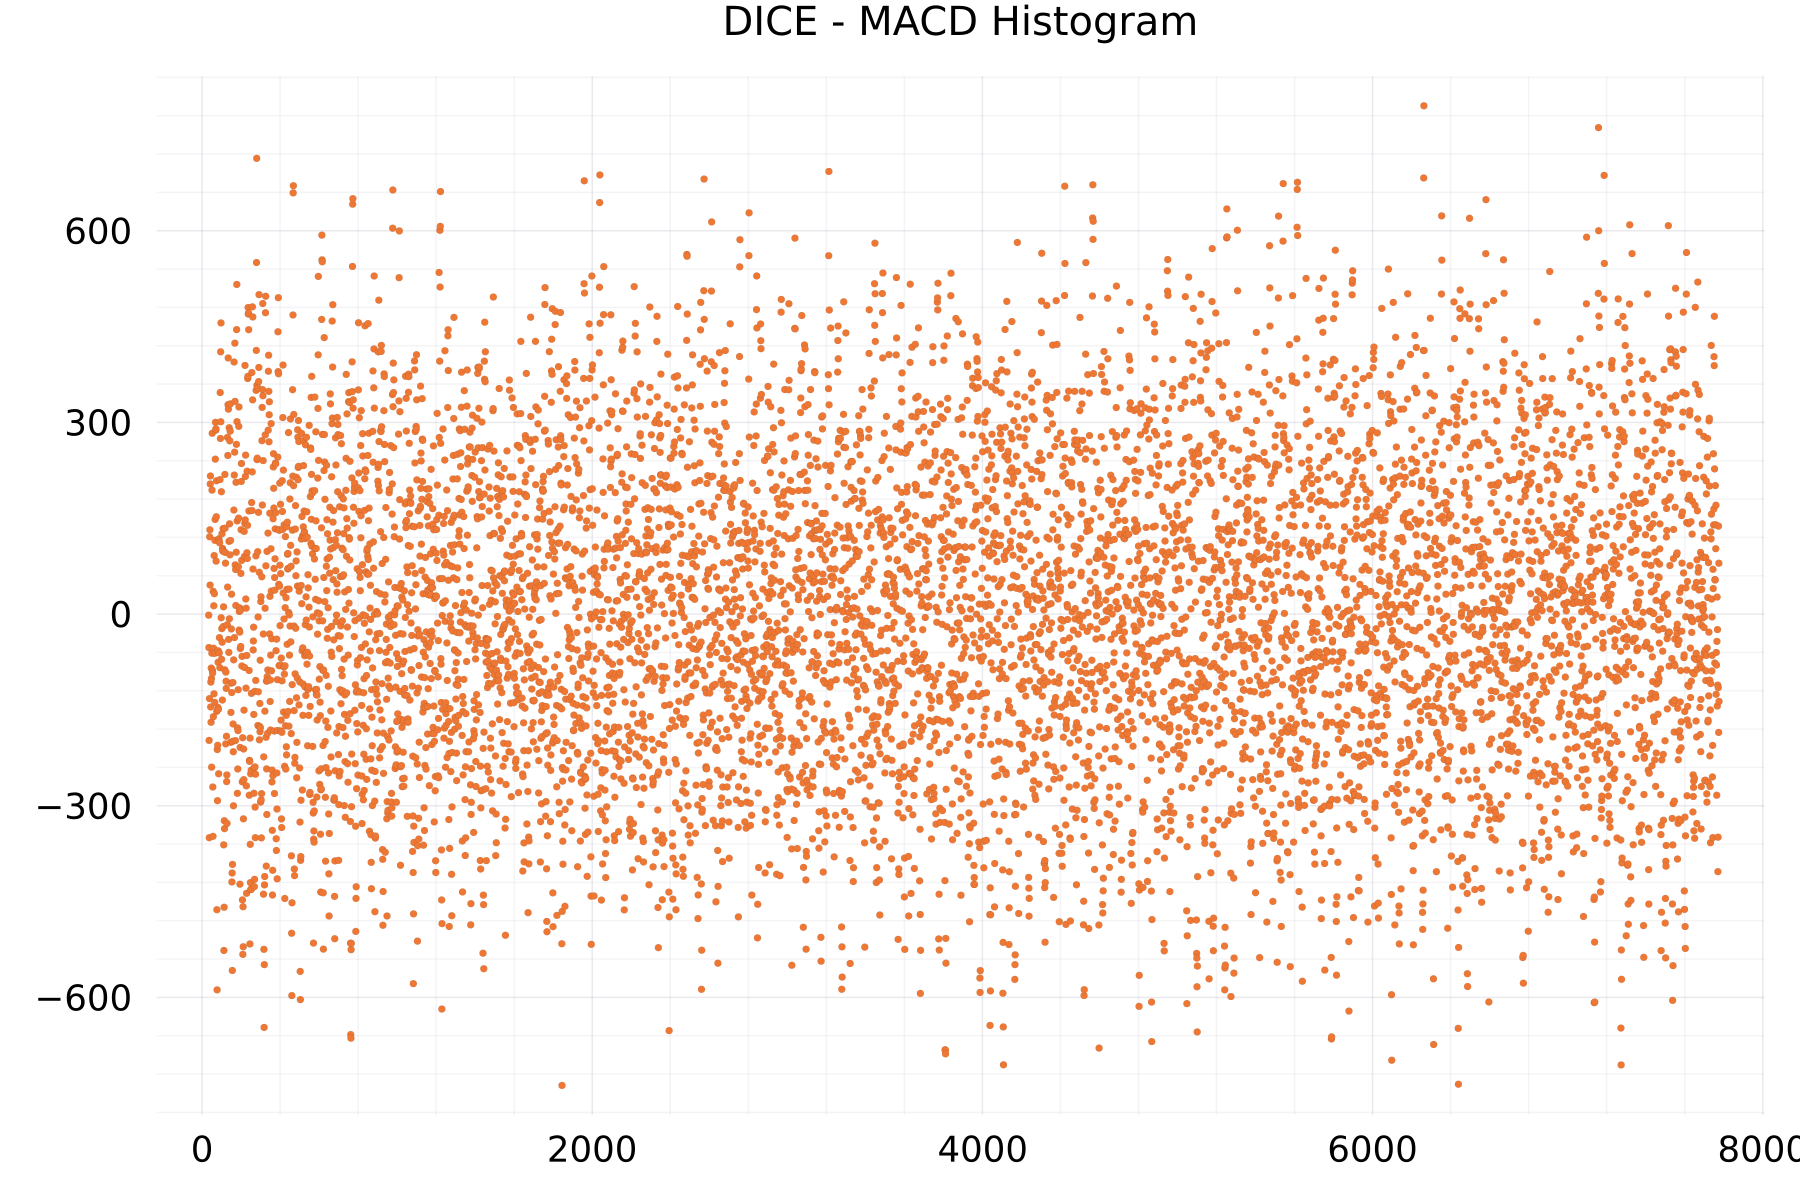
MACD Histogram Plots
The plot shows as example for the DICE alphabet the histogram of the moving average convergence divergence of 7,776 scores.
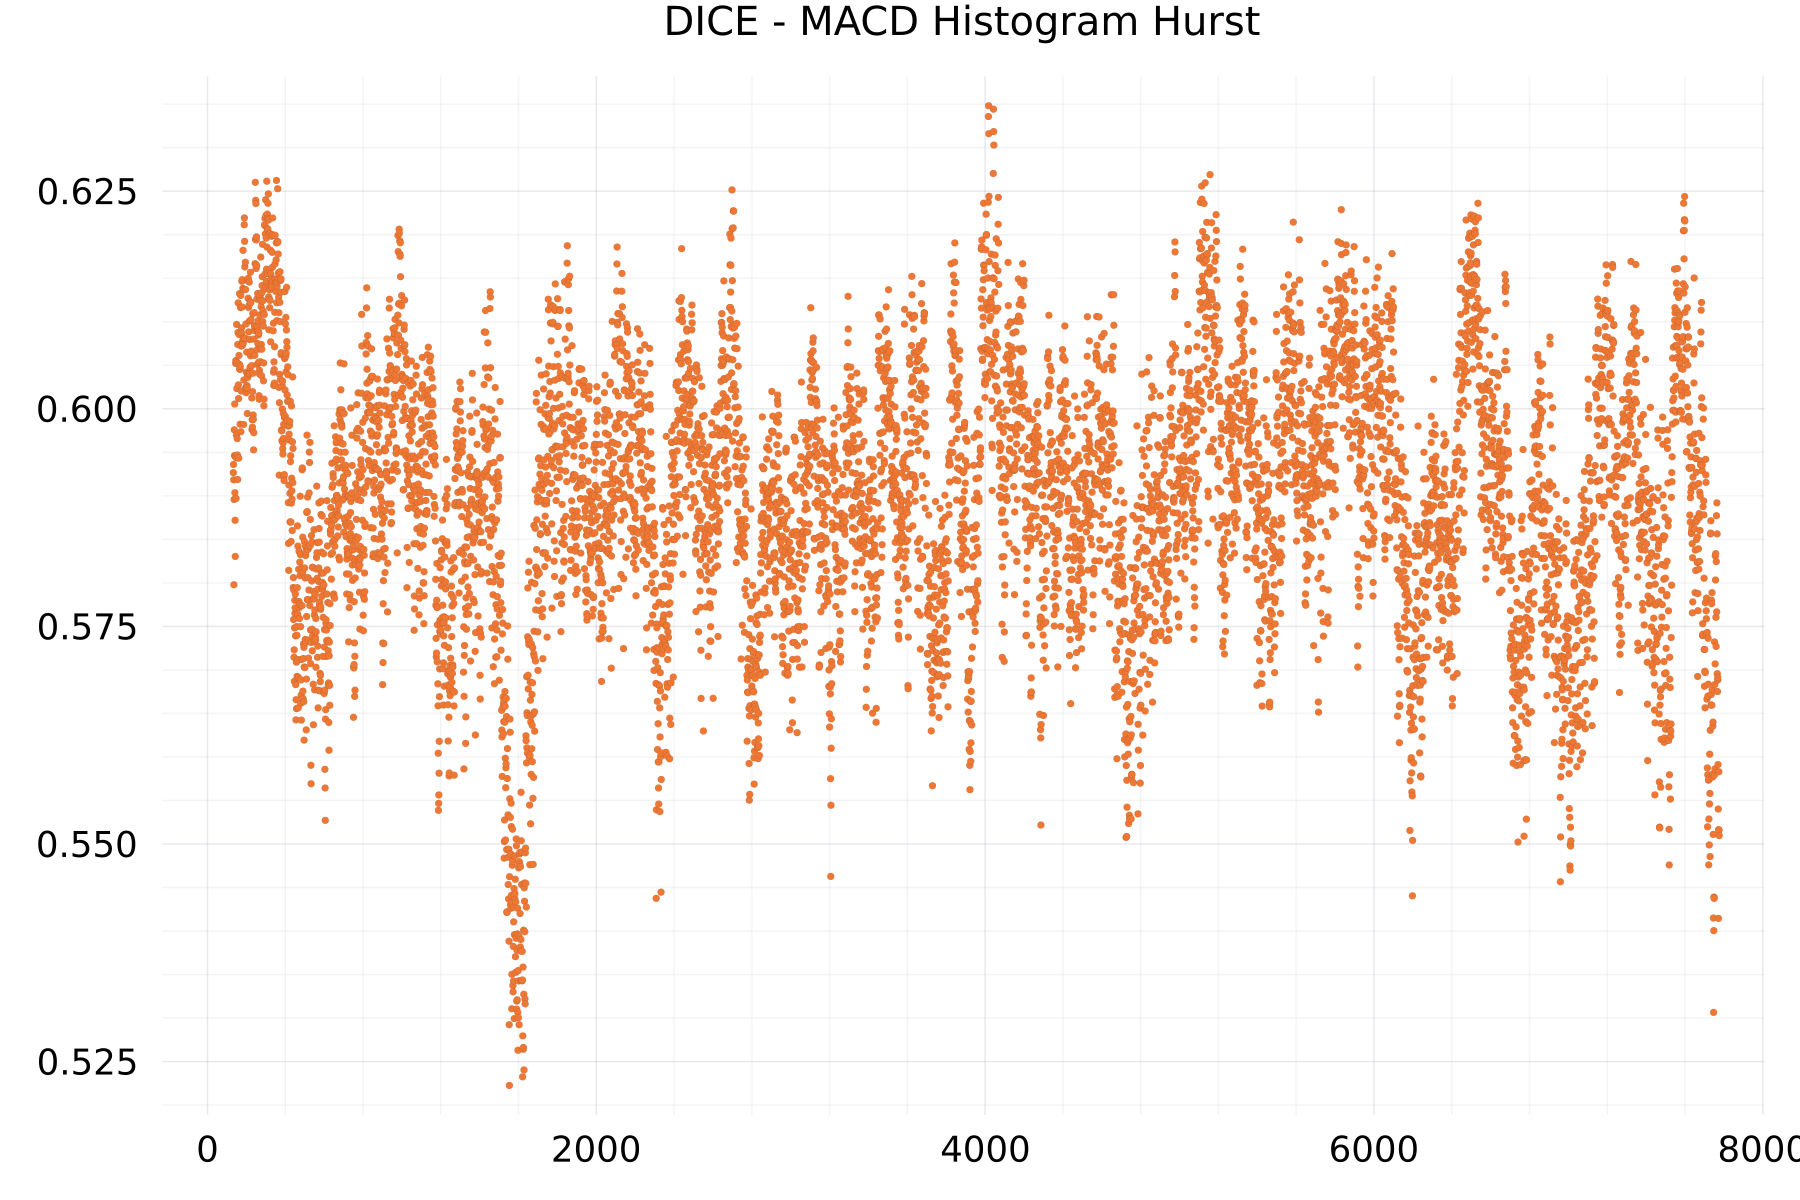
MACD Histogram Hurst Plots
The plot shows as example for the DICE alphabet the hurst exponent of the histogram of the moving average convergence divergence of 7,776 scores.
